covid-seird is a small Python package inspired by Henri Froese's post 'Infectious Disease Modelling: Beyond the Basic SIR Model'.
It implements the SEIRD Epidemiological Model on COVID-19 data.
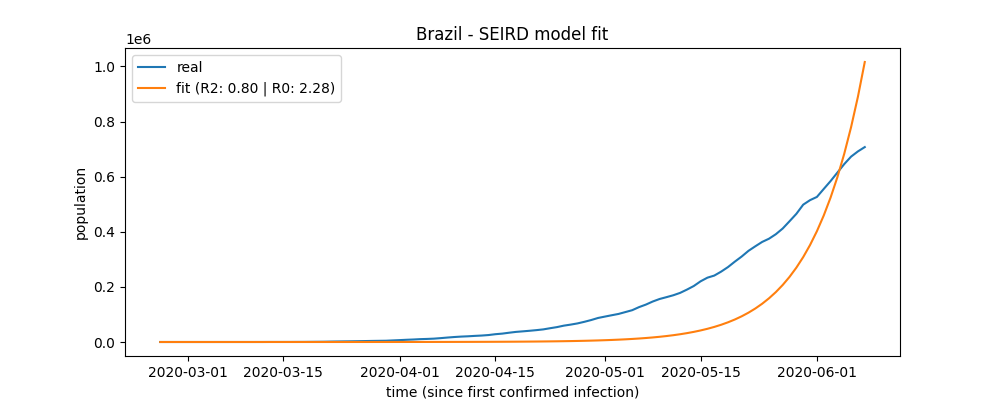
- First, it fits a the SEIRD Model into the real timeline data of confirmed cases of COVID-19 of a country.
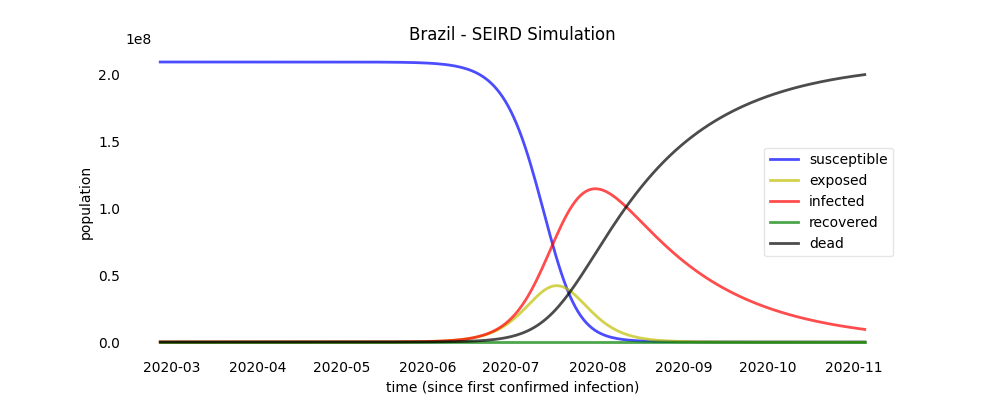
- Then, it simulates the SEIRD curves based on the previously fitted Model.
- As a result, the country's basic reproduction number (Ro) of COVID-19 is computed.
- Also, the fit and simulation plots are available.
NOTE: The COVID-19 timelines data are obtained using the COVID19Py package in order to retrieve the Worldwide Data repository operated by the Johns Hopkins University Center for Systems Science and Engineering (JHU CSSE).
In order to install this package, simply run:
pip install covid-seirdTo use covid-seird, you first need to import the package and then create a new instance, passing the country code as a parameter:
from covid_seird import CountryCovidSeird

brazil = CountryCovidSeird("br")CountryCovidSeird.code_search("brazil")output:
{'BR': 'Brazil'}brazil.fit()After the fit method's call, the fit score (R2) can be accessed:
brazil.r2output:
0.797994368607109Also after fit method's call, the basic reproduction number (Ro) will be available:
brazil.r0output:
2.280428864655168brazil.plot_fit("brazil_fit_plot")a plot file named 'brazil_fit_plot' will be created.
The simulation method receives as a parameter how many days ahead of the real data the SEIRD model will be computed.
brazil.simulation(days_ahead=150)The SEIRD curves can be accessed after the simulation method's call
brazil.curves['infected']output:
array([4.77396851e-09, 5.32992037e-09, 5.95375686e-09, 6.59631344e-09,
       7.32558927e-09, 8.14396099e-09, 9.05142859e-09, 1.00479921e-08,
       ...
       7.48473200e-03, 7.06776956e-03, 6.67386382e-03, 6.30175876e-03,
5.95026480e-03, 5.61825534e-03, 5.30466353e-03, 5.00847963e-03])brazil.plot_simulation("brazil_simulation_plot")a plot file named 'brazil_simulation_plot' will be created.


