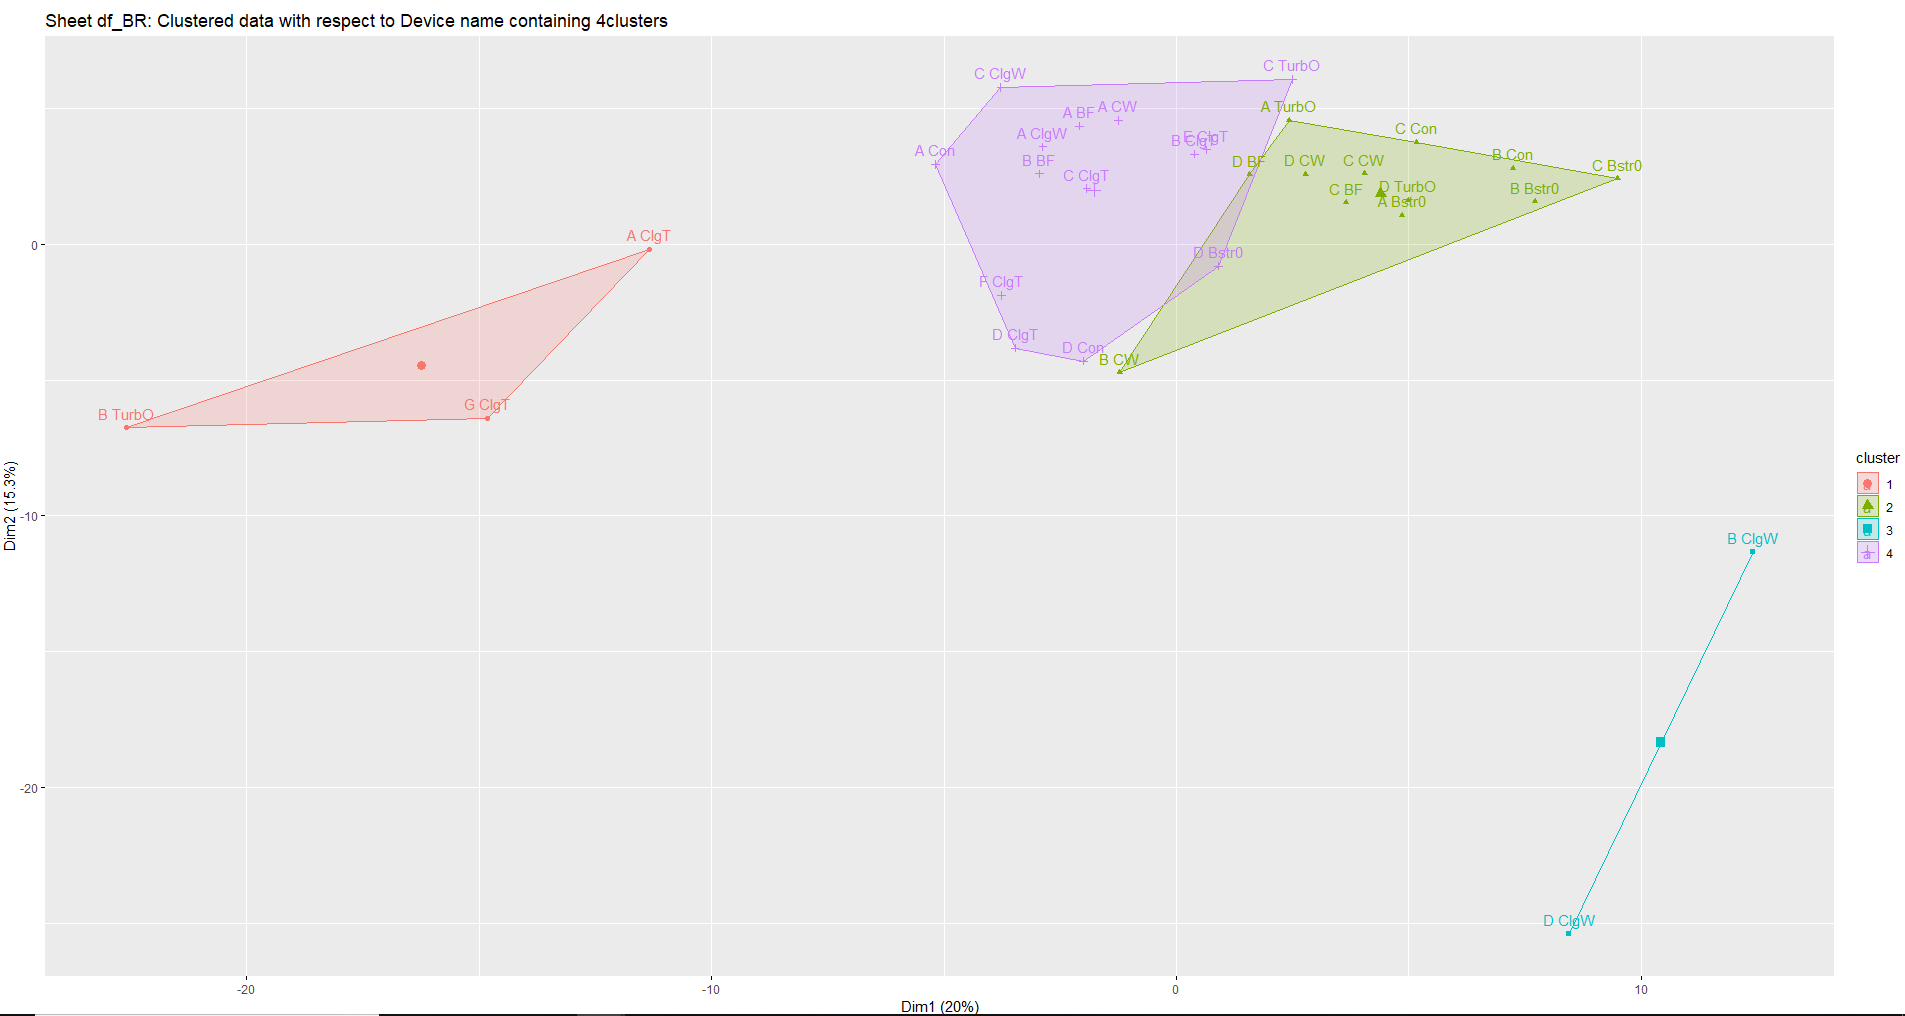
Implementation of hierarchical clustering on small n-sample dataset with very high dimension
-
Basically a good visual representation of the data with easily viewable outliers and differently trending data.
-
five subgroups and how they compare to each other in a cluster of devices. Any device that is trending differently or higher compared to others.
-
And device clusters among like kind (device names are similar across the 5 subgroups) that display those out of the pack - outliers.
Optimized cluster value k is 4 in most cases.
