Here, I did some data analysis using the last 100+ years of Earthquake data covering South Asia and Bangladesh region
This was a web scraping project along with dashboard visualization on Tableau.
I scraped and extracted data from a website using Python with the help of Request and BeautifulSoup libraries. The source of the data was this website.
This project aimed to scrape and extract data for data analysis on Earthquake data encompassing Bangladesh and other neighboring countries like India, Myanmar & Bhutan. This analysis was done to get insights into the data like the magnitudes of the Earthquakes that took place over the last century since 1900, where, occurred mostly in which month and in which region, and more. The insights from the extracted data were later visualized using the popular data visualization tool, Tableau.
Note: This website only shows earthquakes since 1900 starting from a minimum magnitude of 5 or higher.
Here's the link to the Tableau Dashboard for the scraped data: Earthquake Data Tableau Dashboard 14 Sheets & 8 Dashboards
CSV file link: File
| Serial | Date | Day | Month | Year | Time (GMT) | Latitude (N) | Longitude (E) | Magnitude | Location | Country |
|---|---|---|---|---|---|---|---|---|---|---|
| 0 | Jun 16, 2023 | 16 | June | 2023 | 04:46 | 24.75 | 92.0418 | 5.0 | Near Shillong | India |
| 1 | Nov 25, 2021 | 25 | November | 2021 | 23:45 | 22.81 | 93.5248 | 6.2 | Myanmar (Burma): 19 Km SW of Falam | Myanmar |
| 2 | Apr 28, 2021 | 28 | April | 2021 | 2:24 | 26.75 | 92.42 | 6.0 | Northeastern India | India |
| 3 | Oct 10, 2020 | 10 | October | 2020 | 17:38 | 24.56 | 93.58 | 5.4 | Myanmar-India Border Region | Myanmar-India Border |
| 4 | Aug 30, 2020 | 30 | August | 2020 | 1:47 | 23.4098 | 92.0087 | 5.1 | 33 Km N of Khagrachhari | Bangladesh |
| 5 | Aug 27, 2020 | 27 | August | 2020 | 12:07 | 23.06 | 93.29 | 5.3 | Myanmar-India Border Region | Myanmar-India Border |
| 6 | Jun 21, 2020 | 21 | June | 2020 | 22:40 | 23.15 | 93.32 | 5.5 | Myanmar-India Border Region | Myanmar-India Border |
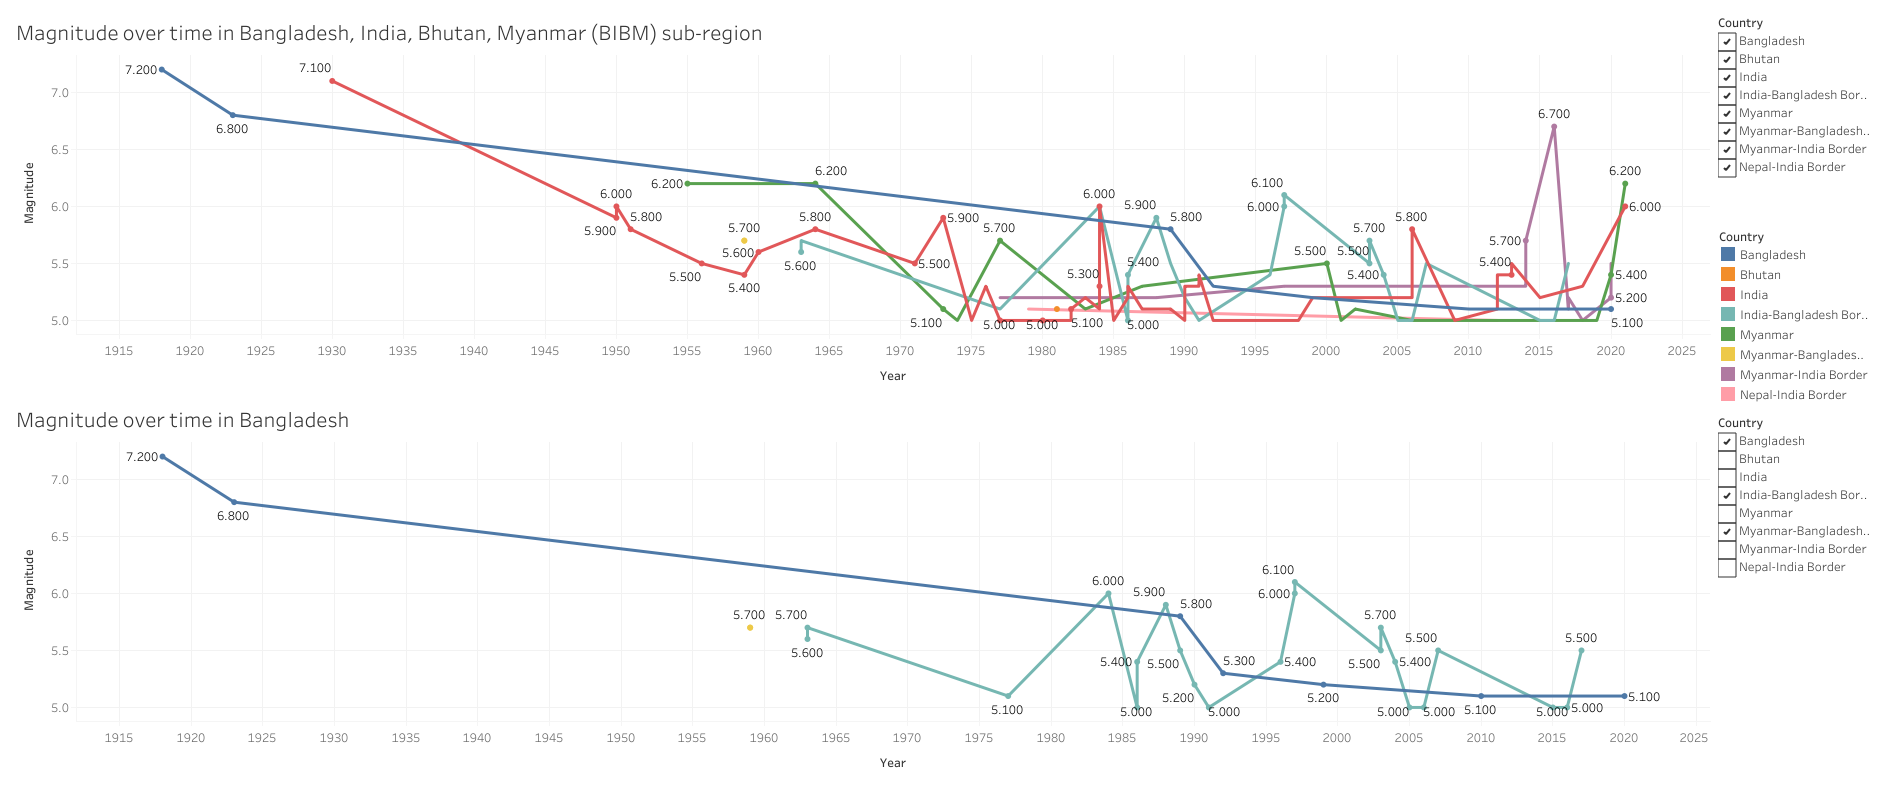
- The highest recorded earthquake in the last hundred-plus years in this Bangladesh-India-Bhutan-Myanmar region was 7.2 in magnitude on 8th July 1918. It took place in Bangladesh.
- The lowest recorded earthquake in the last hundred-plus years in this Bangladesh-India-Bhutan-Myanmar region according to the website is 5 in magnitude which took place in multiple regions of BIBM, But mostly in India and India-Bangladesh border region.
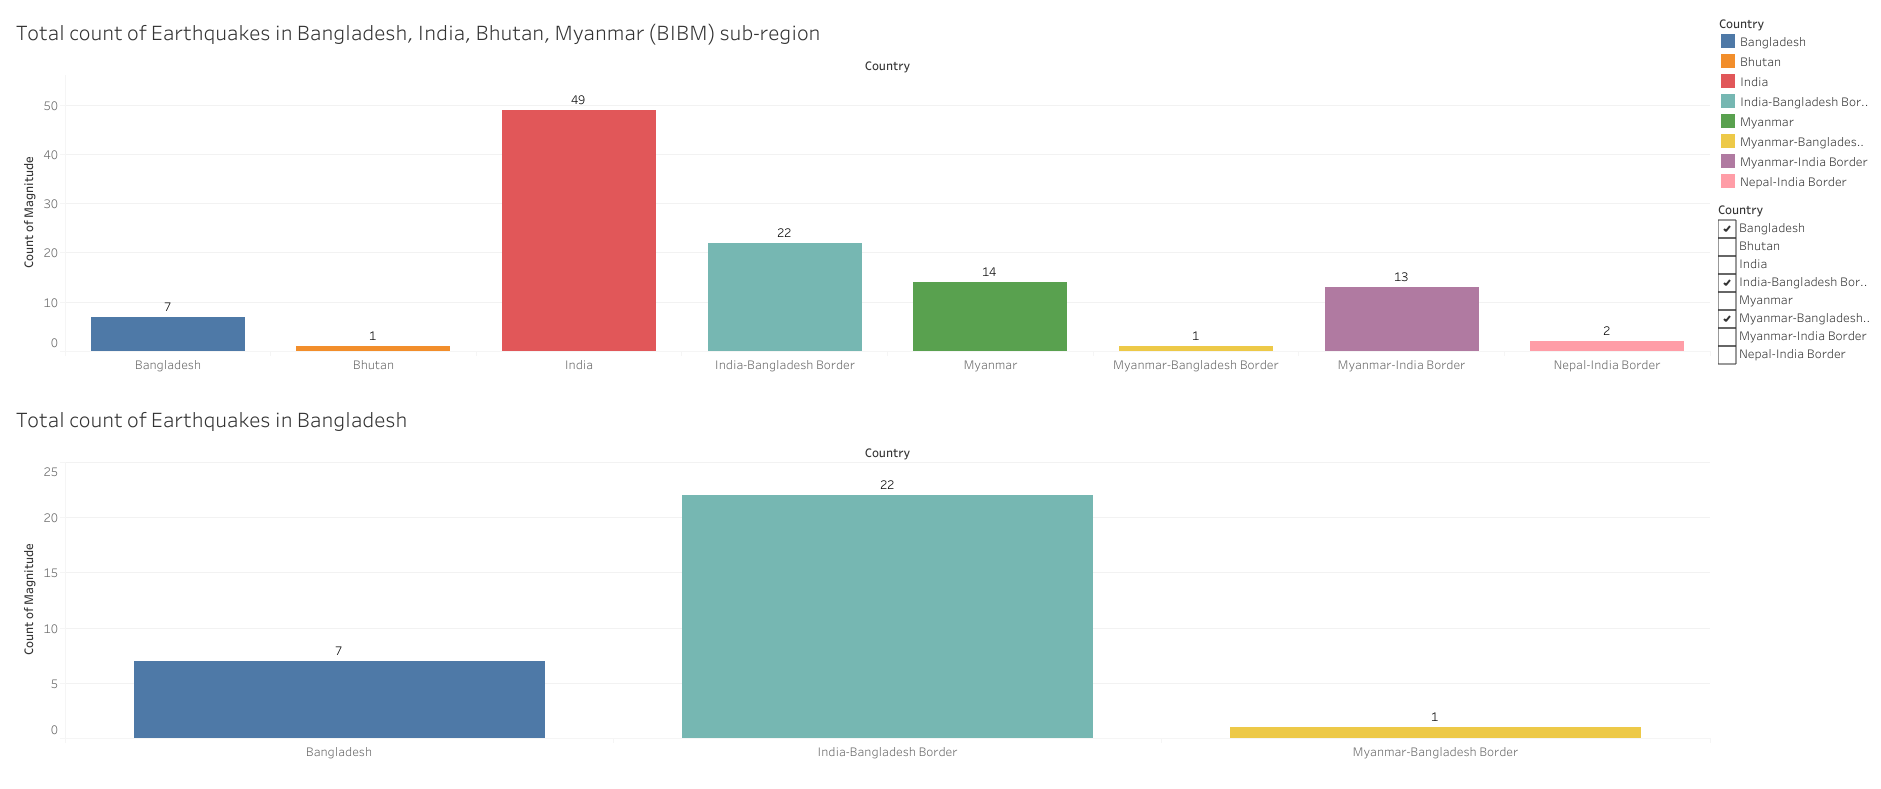
- The greatest number of earthquakes took place in India (49 in total)
- In the Bangladesh region, There were respectively 22, 7, & 1 earthquakes in the Bangladesh-India border region, Bangladesh, and Bangladesh-Myanmar border region.
- The lowest number of earthquakes took place in Bhutan and Myanmar-Bangladesh border regions (Both 1).
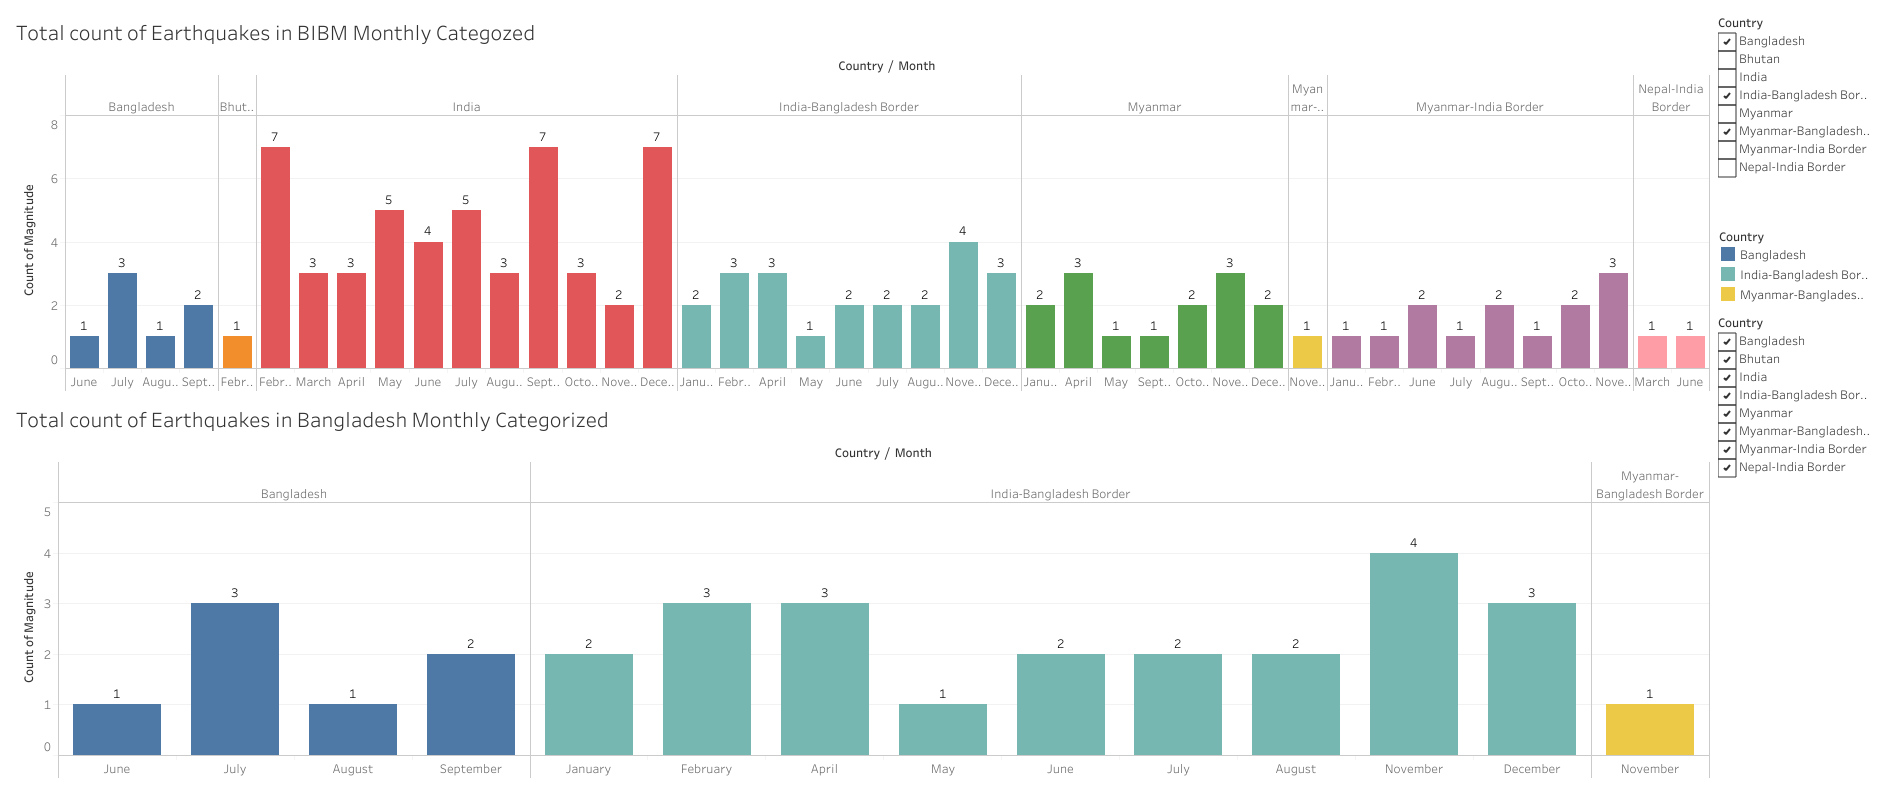
- In the BIBM region, earthquakes mostly took place in February, September & December. All 7 in number and all in India.
- In the Bangladesh region, earthquakes mostly took place in November in the India-Bangladesh border region. 4 in quantity.
- In the BIBM region, a maximum number of earthquakes took place in November. 13 in total.
- In the Bangladesh region, a maximum number of earthquakes took place in July & November Both 5 in quantity.
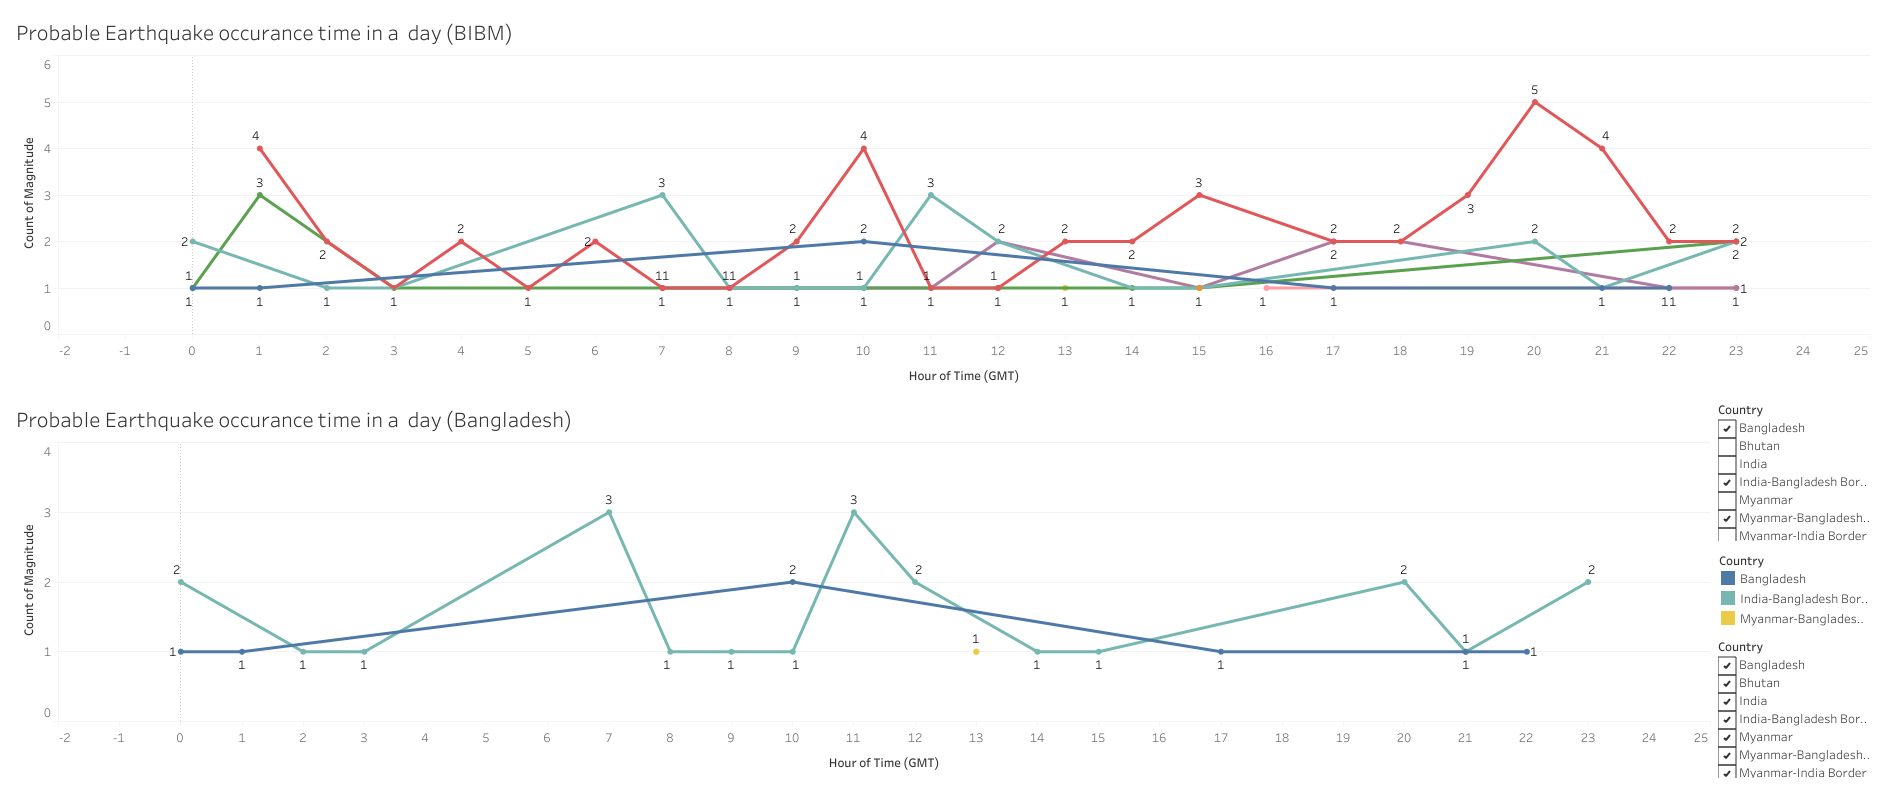
- In the BIBM region, Earthquakes mostly took place around 20.00 GMT, All in India, and a total of 5 in quantity.
- In the Bangladesh region, Earthquakes mostly took place around 7.00 GMT & 11.00 GMT, All in the India-Bangladesh border region & both 3 in quantity.
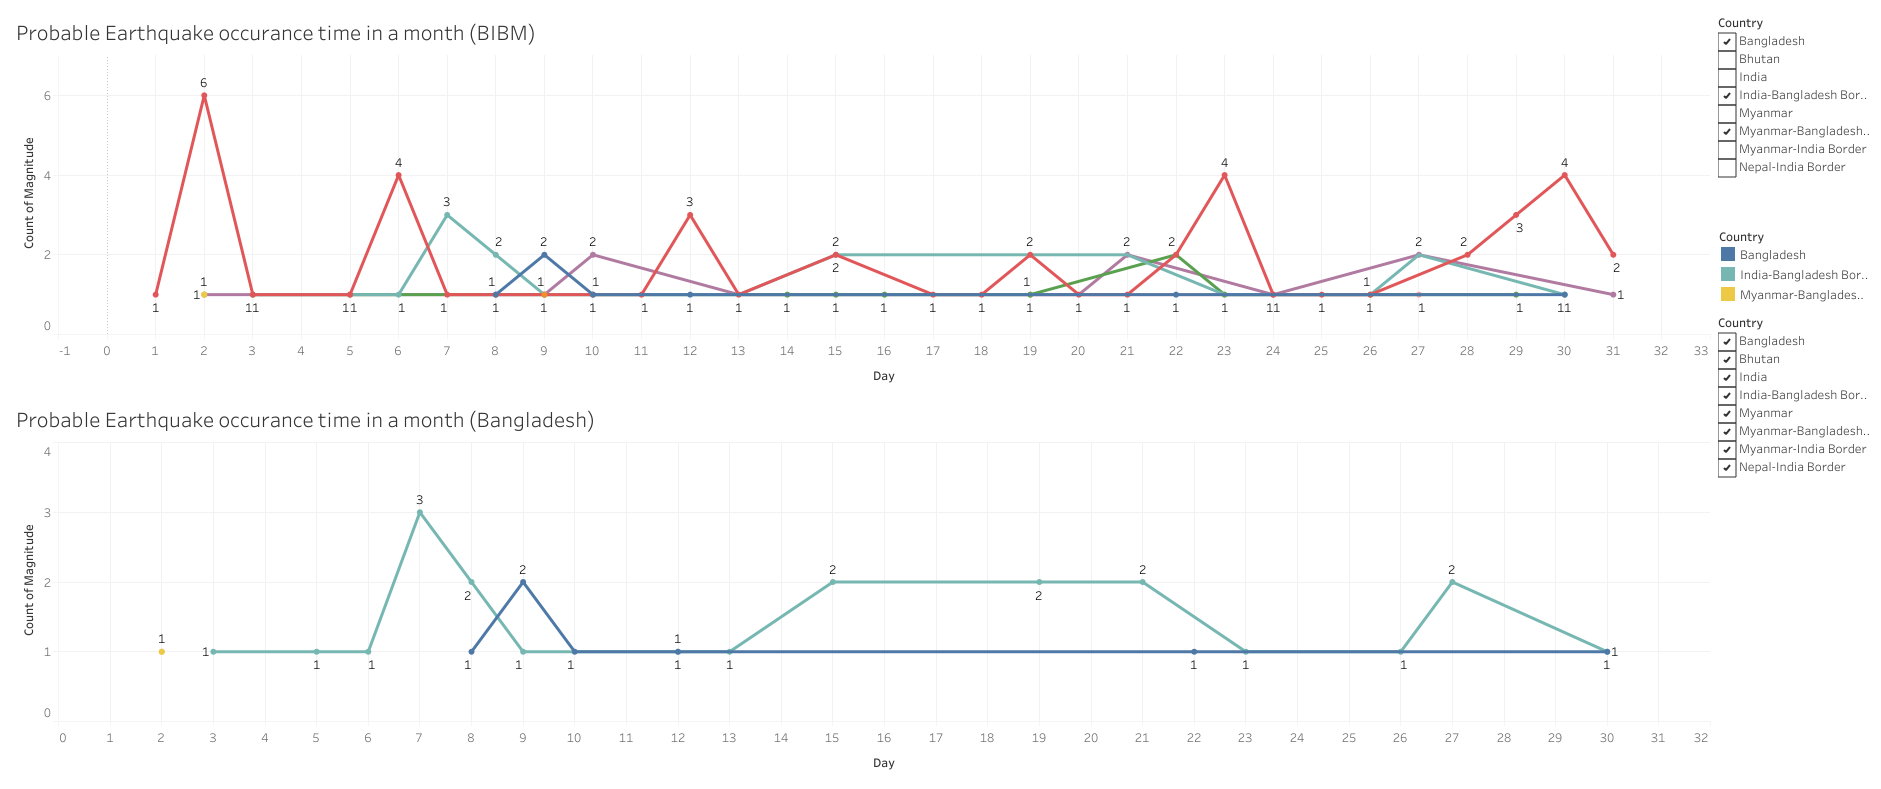
- In the BIBM region, Earthquakes mostly took place on the 2nd day of the month, 6 in quantity.
- In the Bangladesh region, Earthquakes mostly took place on the 7th day of the month, 3 in quantity.
- Location-wise, In BIBM region Earthquakes mostly took place in the India-Bangladesh border region (22), then Assam (21), and then the Myanmar-India border region (17).
- Country-wise, In the BIBM region, The name of the countries and the number of total earthquakes since 1918 are Bangladesh (7), India (49), Bhutan (1) & Myanmar (14).
- Clone the repository
git clone https://github.com/RezuwanHassan262/Last-100-plus-years-Earthquake-Data-Analysis-And-Visualization
- Go to the project directory
cd Last-100-plus-years-Earthquake-Data-Analysis-And-Visualization
- Initialize and activate Virtual Environment
virtualenv --no-site-packages  venv
source venv/bin/activate
- Install dependencies
pip install -r requirements.txt
- Run the scrapper:
python Last-100-plus-years-Earthquake-Data-Analysis-And-Visualization/scraper.py
- The CSV file named 'EarthquakeData.csv' will be generated within the project directory.
.png)
.png)
%20sub-region%20(Map).png)