-
Notifications
You must be signed in to change notification settings - Fork 71
New issue
Have a question about this project? Sign up for a free GitHub account to open an issue and contact its maintainers and the community.
By clicking “Sign up for GitHub”, you agree to our terms of service and privacy statement. We’ll occasionally send you account related emails.
Already on GitHub? Sign in to your account
Line voronoi diagram and network voronoi diagram features #292
Comments
|
(apologies that this take so long to log to GitHub) |
|
@ResidentMario Thanks for logging this. Hopefully this will be something I can get started on in the next several months. It will be super exciting to have this functionality included in @ljwolf @sjsrey @weikang9009 @knaaptime @renanxcortes @slumnitz |
Yes, @jGaboardi, I think too that it probably makes more sense on I mean... we could add |
|
If it's any incentive, I wrote a hacky single-use package called |
|
@ResidentMario |
|
I could upload something to the |
|
Yeah, or even just a link to something (this is something for my own curiosity). The explanation and docstrings of |
|
Hi @jGaboardi, you weren't the only person to ask me this question, so I figured it was worth the time to write up a short blog post explaining how the This post links to the polished blog post with the analysis I used this library for as well as the repo with all of the raw code I wrote. Some of the use cases of having this point-to-line-to-adjacent-polygon algorithm on hand included:
|
|
We may want to explore:
|
|
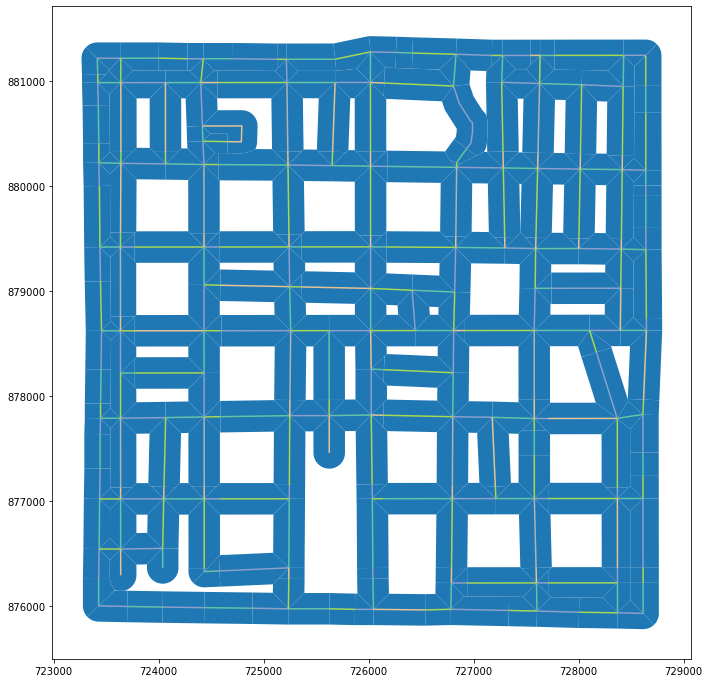
I think that this is already implemented in import momepy
import geopandas
from shapely.geometry import box
from mapclassify import greedy
from libpysal import examples
path = examples.get_path("streets.shp")
gdf = geopandas.read_file(path)
# fill study area with tessellation
study_area = box(*gdf.total_bounds).buffer(50)
tess = momepy.Tessellation(gdf, 'ID', limit=study_area)
ax = tess.tessellation.plot(figsize=(12, 12), edgecolor='w')
gdf.plot(greedy(gdf, strategy="largest_first"), ax=ax, categorical=True, cmap='Set2')# limit to 150 feet from network geometry
tess = momepy.Tessellation(gdf, 'ID', limit=momepy.buffered_limit(gdf, 150), segment=10)
ax = tess.tessellation.plot(figsize=(12, 12))
gdf.plot(greedy(gdf, strategy="largest_first"), ax=ax, categorical=True, cmap='Set2')It is not properly documented, but it should do what you are looking for. |
|
@martinfleis this is another great example for your push to standardize the network instances. |
|
Which reminds me that on one end of the conversion pipeline should be non-graph geodataframe. Since the example above is using gdf, not graph. |
|
@martinfleis let's revisit this in the not-to-distant future. |
|
My proposal is to move generic voronoi algos from momepy to libpysal.cg and document it all there. Those could potentially also take a graph as an input, but we first need the standard of storing edge geometries in a graph. |


By way of background, this feature request was spawned by work I am doing on analyzing a dataset of trash pickup locations in San Francisco. The fundamental problem with this dataset is that GPS coordinates are inaccurate, so the point data needs to be snapped to nearby linear features (streets, blockfaces) and polygonal features (buildings, blocks) for analysis. I started a discussion in the PySAL Gitter regarding the best way to approach a specific problem in this projection:
@jGaboardi helpfully replied with the following comment:
This issue is that feature request for the following additional types of Voronoi diagram generation and point-snapping algorithms (in addition to the existing):
The text was updated successfully, but these errors were encountered: