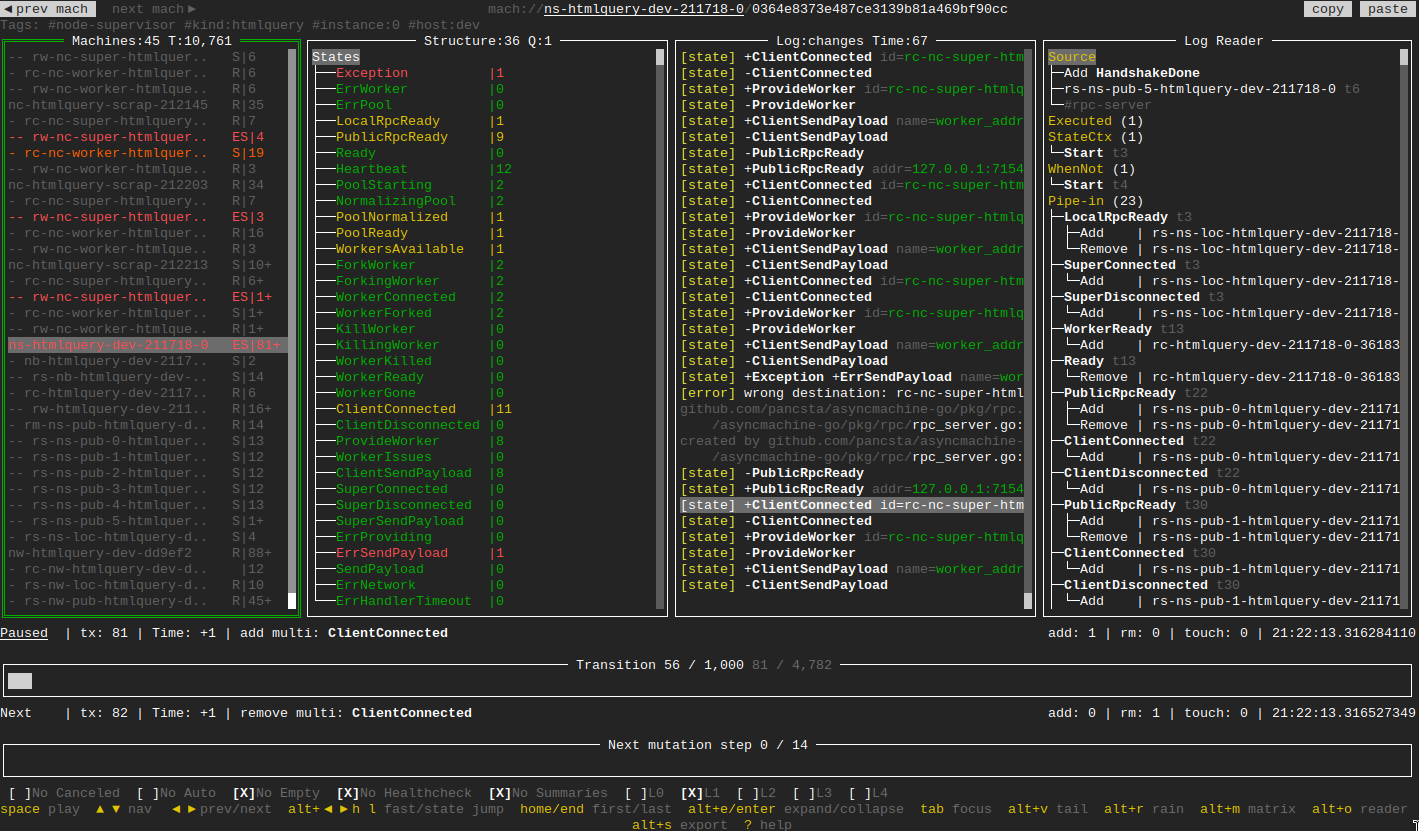
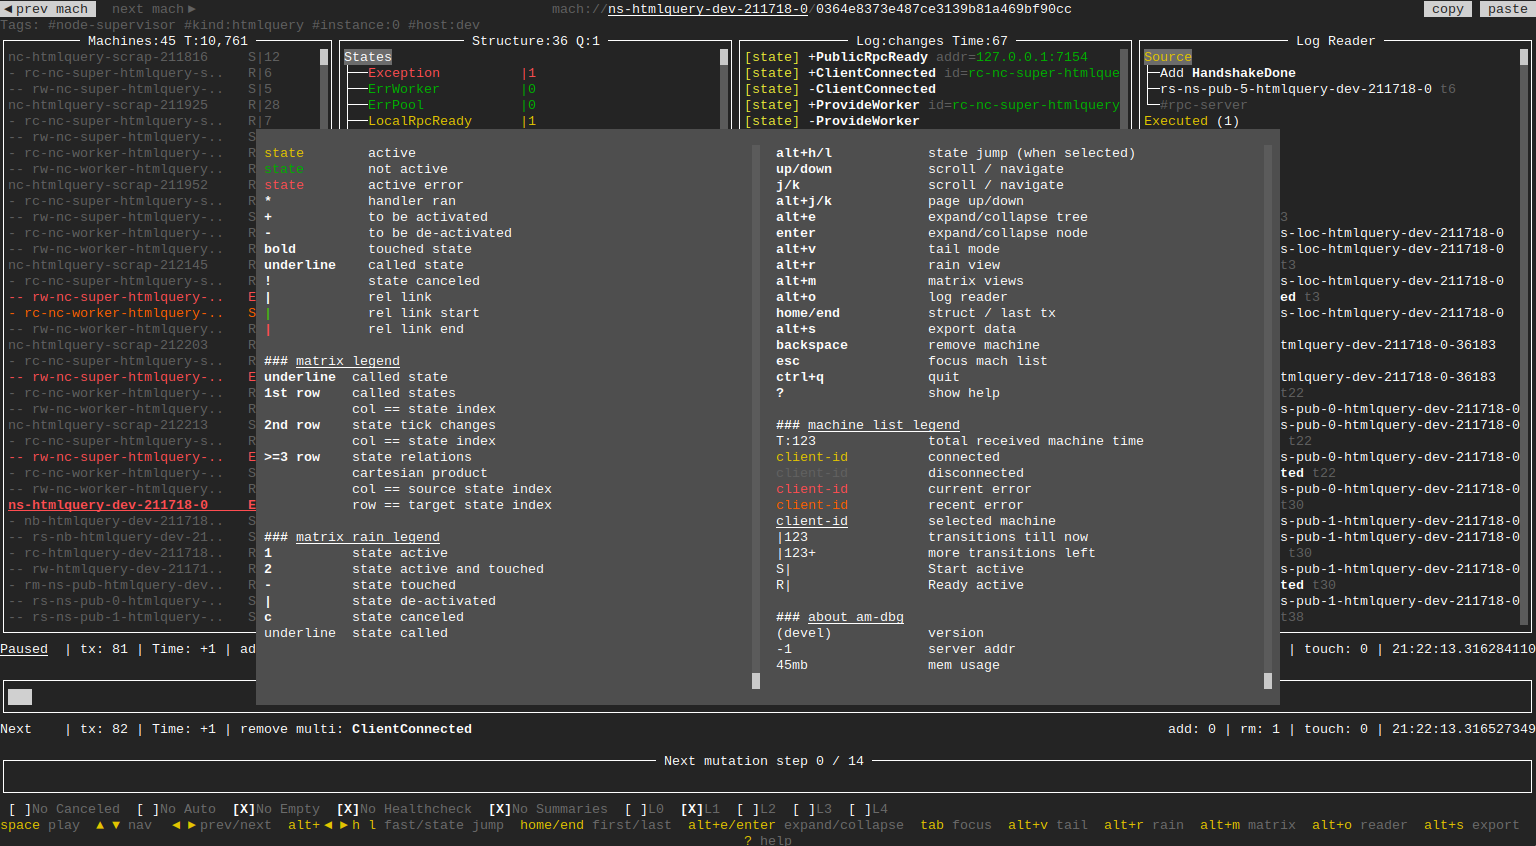
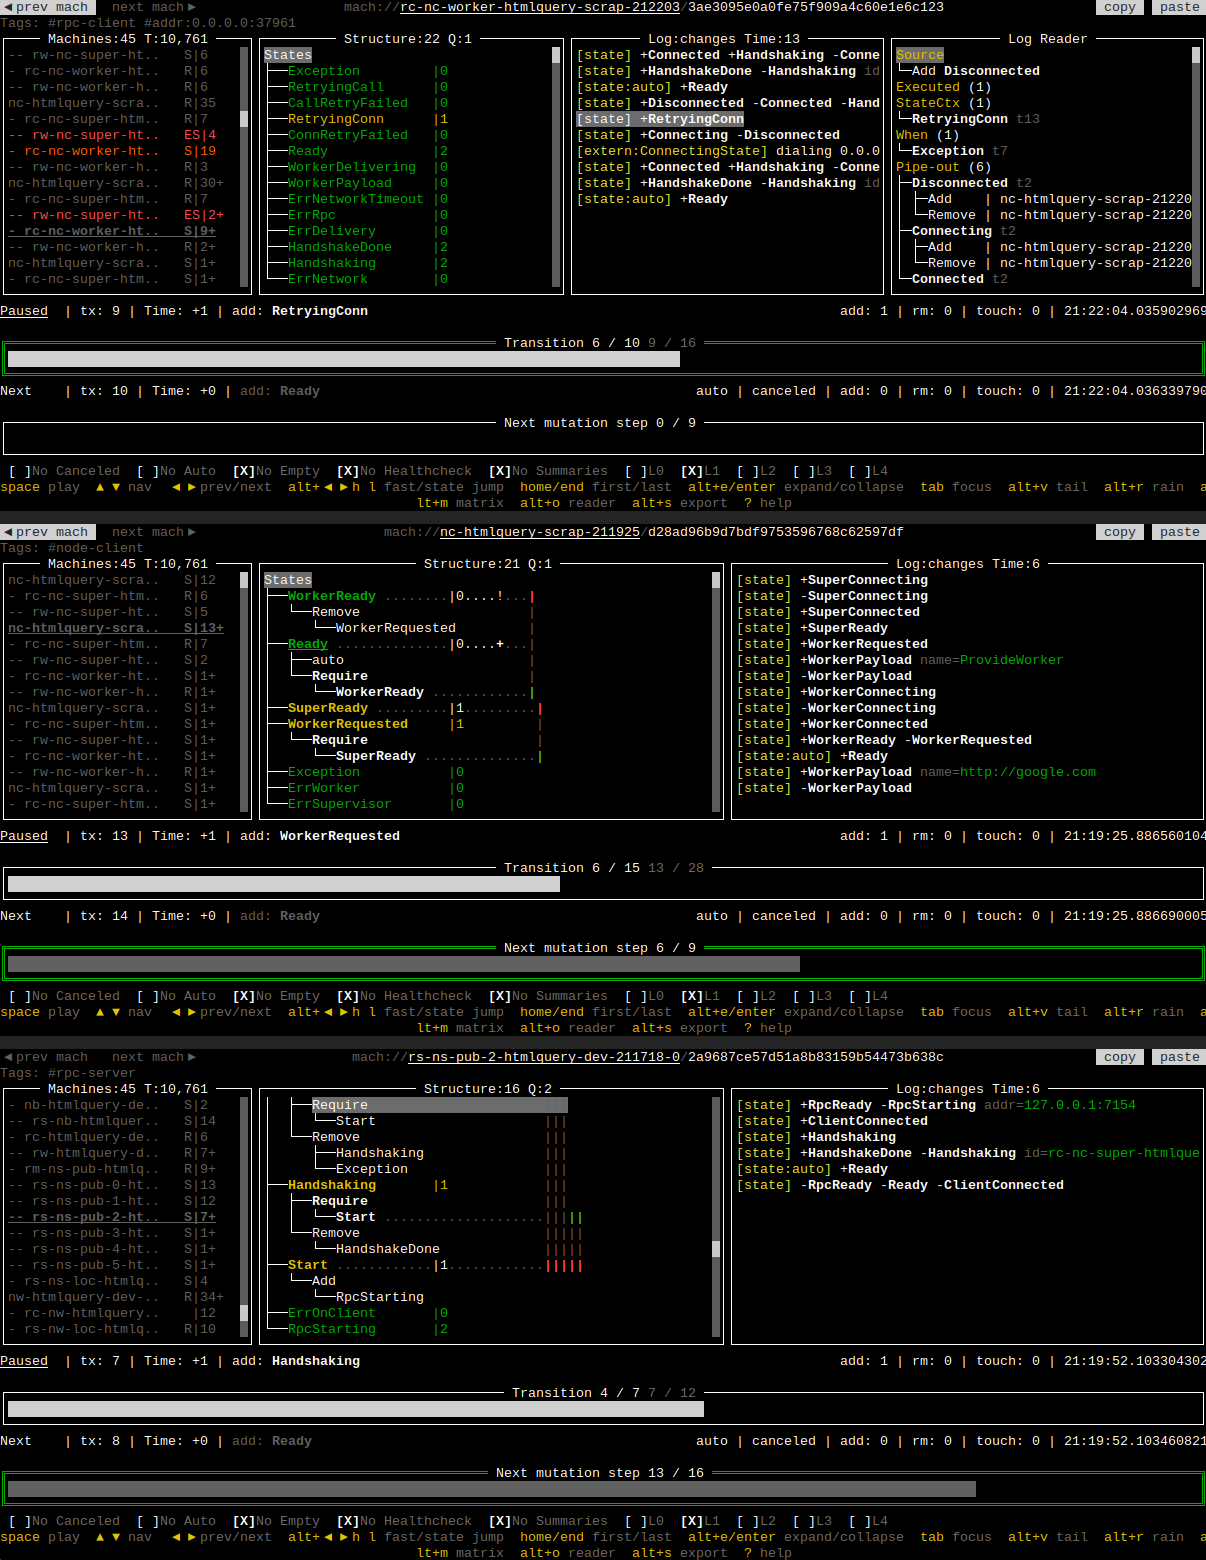
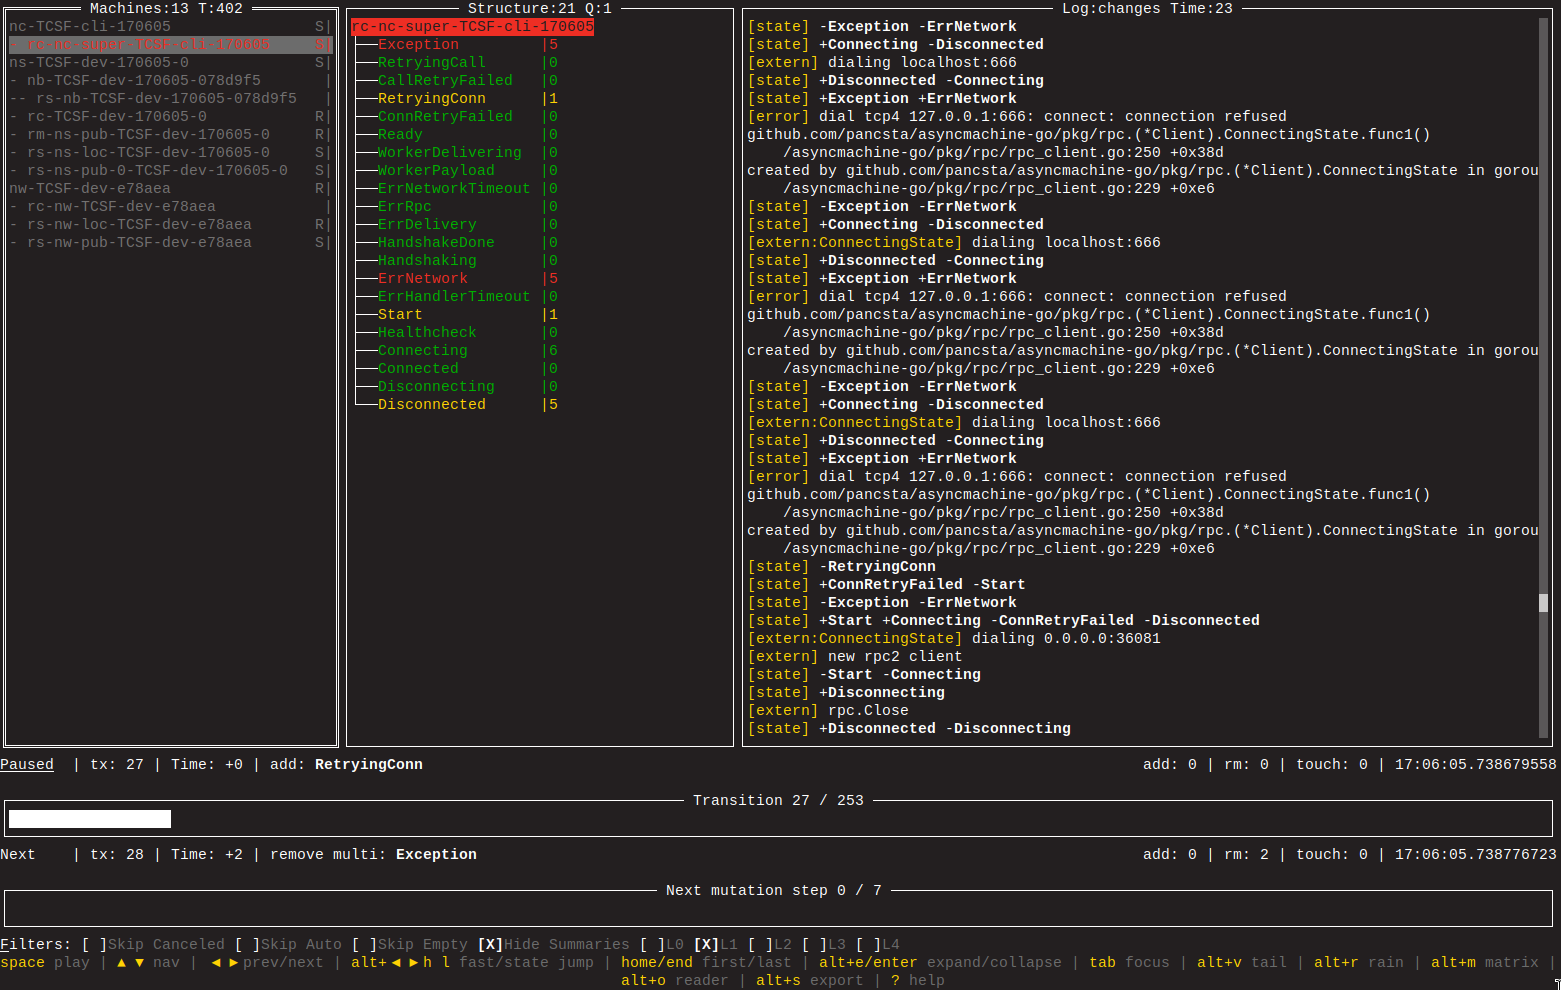
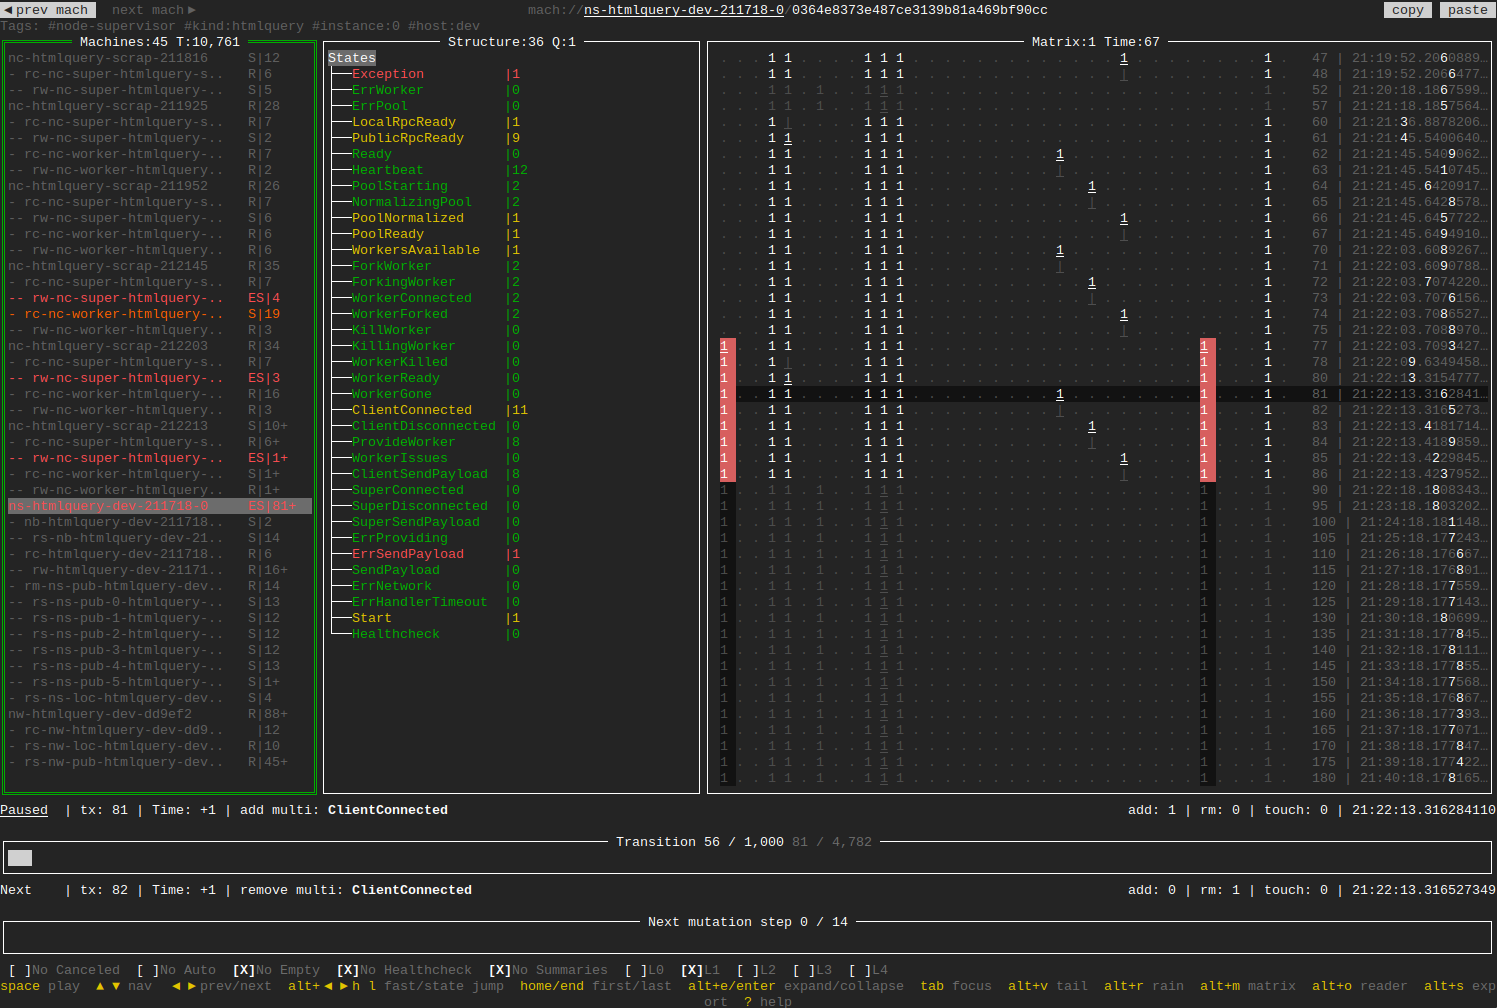
am-dbg is a lightweight, multi-client debugger which can handle hundreds of simultaneous streams from asyncmachines.
It's built around a timeline of transitions and allows for precise searches and drill-downs of state mutations.
|
|
- Download a release binary
- Install
go install github.com/pancsta/asyncmachine-go/tools/cmd/am-dbg@latest - Run directly
go run github.com/pancsta/asyncmachine-go/tools/cmd/am-dbg@latest
Note
asyncmachine-go is a declarative control flow library implementing AOP and Actor Model through a clock-based state machine.
- states tree: list of all states and relations of the selected state machine, with their clock ticks, search-as-you-type, and error highlighting.
- log view: highlighted log view with the current transition being selected.
- address bar: navigate the hitory with 2 entries per machine.
- stepping through transitions: draws relations graph lines of the resolutions process in the states tree.
- time travel: transition and steps timelines allow to navigate in time, even between different state machines.
- transition info: show number, machine time, type, states, states, and human time of each transition.
- import / export: using Brotli and
encoding/gob, it's easy to save and share dump files. - filters: filters narrow down both the number of transitions, and log messages.
- rain view: high-level view of transitions with error highlighting and human time, one per line.
- client list: all the currently nad previously connected state machines, with search-as-you-type, error highlighting, and remaining transitions marker.
- fast jumps: jump by 100 transitions, or select a state from the tree and jump to its next occurrence.
- keyboard navigation: the UI is keyboard accessible, just press the ? key.
- mouse support: most elements can be clicked and some scrolled.
- SSH access: an instance of the debugger can be shared directly from an edge server via a built-in SSH server.
- log rotation: older entries will be automatically discarded in order.
- log reader: extract entries from LogOps into a dedicated pane.
- source event: navigate to source events, internal or external.
- handlers: list executed handlers.
- contexts: list state contexts and mach time.
- subscriptions: list awaited clocks.
- piped states: list all inbound and outbound pipes.
Usage:
  am-dbg [flags]

Flags:
      --am-dbg-addr string      Debug this instance of am-dbg with another one
      --clean-on-connect        Clean up disconnected clients on the 1st connection
      --enable-mouse            Enable mouse support (experimental) (default true)
  -f, --fwd-data string         Fordward incoming data to other instances (eg addr1,addr2)
  -h, --help                    help for am-dbg
  -i, --import-data string      Import an exported gob.bt file
  -l, --listen-on string        Host and port for the debugger to listen on (default "localhost:6831")
      --log-2-ttl string        Max time to live for logs level 2 (default "24h")
      --log-file string         Log file path
      --log-level int           Log level, 0-5 (silent-everything)
      --max-mem int             Max memory usage (in MB) to flush old transitions (default 100)
      --prof-srv string         Start pprof server
  -r, --reader                  Enable Log Reader
  -c, --select-connected        Select the newly connected machine, if no other is connected
  -m, --select-machine string   Select a machine by ID on startup (requires --import-data)
  -t, --select-transition int   Select a transaction by _number_ on startup (requires --select-machine)
      --version                 Print version and exit
  -v, --view string             Initial view (tree-log, tree-matrix, matrix) (default "tree-log")
-
Set up telemetry:
import amhelp "github.com/pancsta/asyncmachine-go/pkg/helpers"
// ...
amhelp.MachDebugEnv(myMach)
-
Run
am-dbg -
Run your code with
AM_DBG_ADDR=localhost:6831
AM_LOG=2
-
Your machine should show up in the debugger
Interactively use the TUI debugger with data pre-generated by libp2p-pubsub-simulator or remote integration tests in one of the available ways below.
PubSub:
go run github.com/pancsta/asyncmachine-go/tools/cmd/am-dbg@latest \
  --select-machine sim-p1 \
  --select-transition 25 \
  --import-data https://pancsta.github.io/assets/asyncmachine-go/am-dbg-exports/pubsub-sim.gob.br
Tests:
go run github.com/pancsta/asyncmachine-go/tools/cmd/am-dbg@latest \
  --select-machine d-rem-worker \
  --select-transition 1100 \
--import-data https://pancsta.github.io/assets/asyncmachine-go/am-dbg-exports/remote-tests.gob.brPubSub:
- web browser: http://188.166.101.108:8080/wetty/ssh
- terminal:
ssh 188.166.101.108 -p 4444
Tests:
- web browser: http://188.166.101.108:8081/wetty/ssh
- terminal:
ssh 188.166.101.108 -p 4445
Small-scale dashboards can be achieved by using the --fwd-data param, with multiple instances am-dbg as
destinations. It will duplicate all the memory allocations and won't scale far.
Download an SSH release binary or use go install:
go install github.com/pancsta/asyncmachine-go/tools/am-dbg-ssh@latest
am-dbg-ssh is an SSH version of asyncmachine-go debugger.

You can connect to a running instance with any SSH client.

Usage:
  am-dbg-ssh -s localhost:4444 [flags]
Go to the steps timelines (bottom one) using the Tab key, then press left/right like before.
Select the state from the Structure pane and press alt+h to state-jump
to previous transitons, or alt+l to further ones.
Press alt+s and Enter.
Press alt+f or Tab until the bottom filter bar receives focus. Now select "Skip Canceled".
Press ? to show the help popup.
Go back to the monorepo root to continue reading.
