Note
asyncmachine-go is a declarative control flow library implementing AOP and Actor Model through a clock-based state machine.
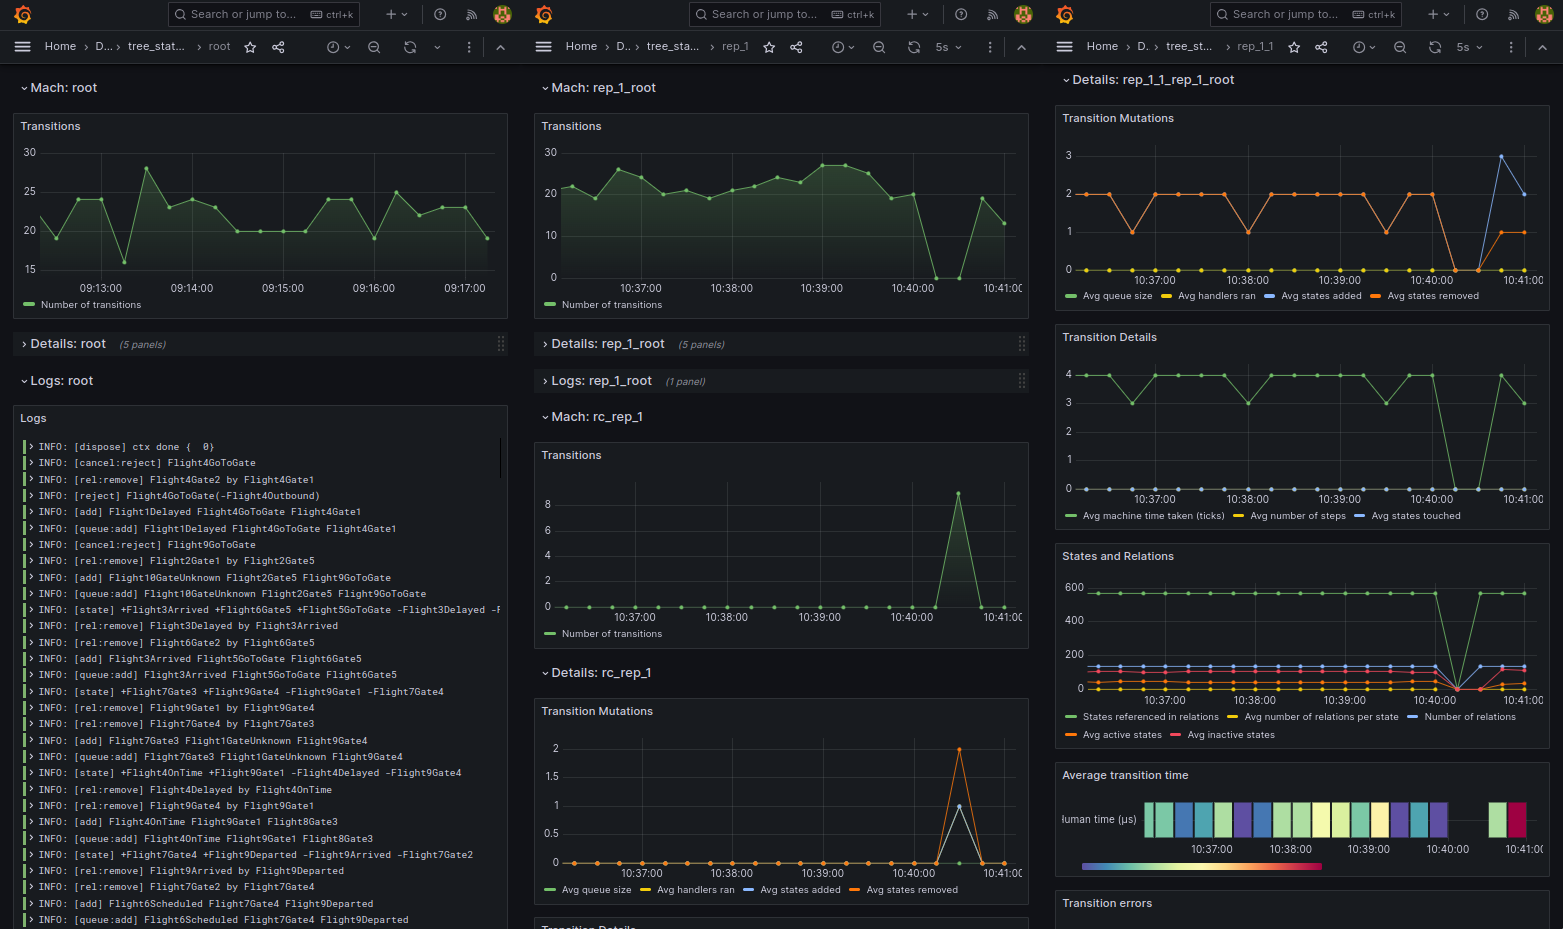
/pkg/telemetry provides several telemetry exporters and a Grafana dashboard:
dbg is simple telemetry used by am-dbg TUI Debugger.
It delivers DbgMsg and DbgMsgStruct via standard net/rpc. It can also be consumed by a custom client.
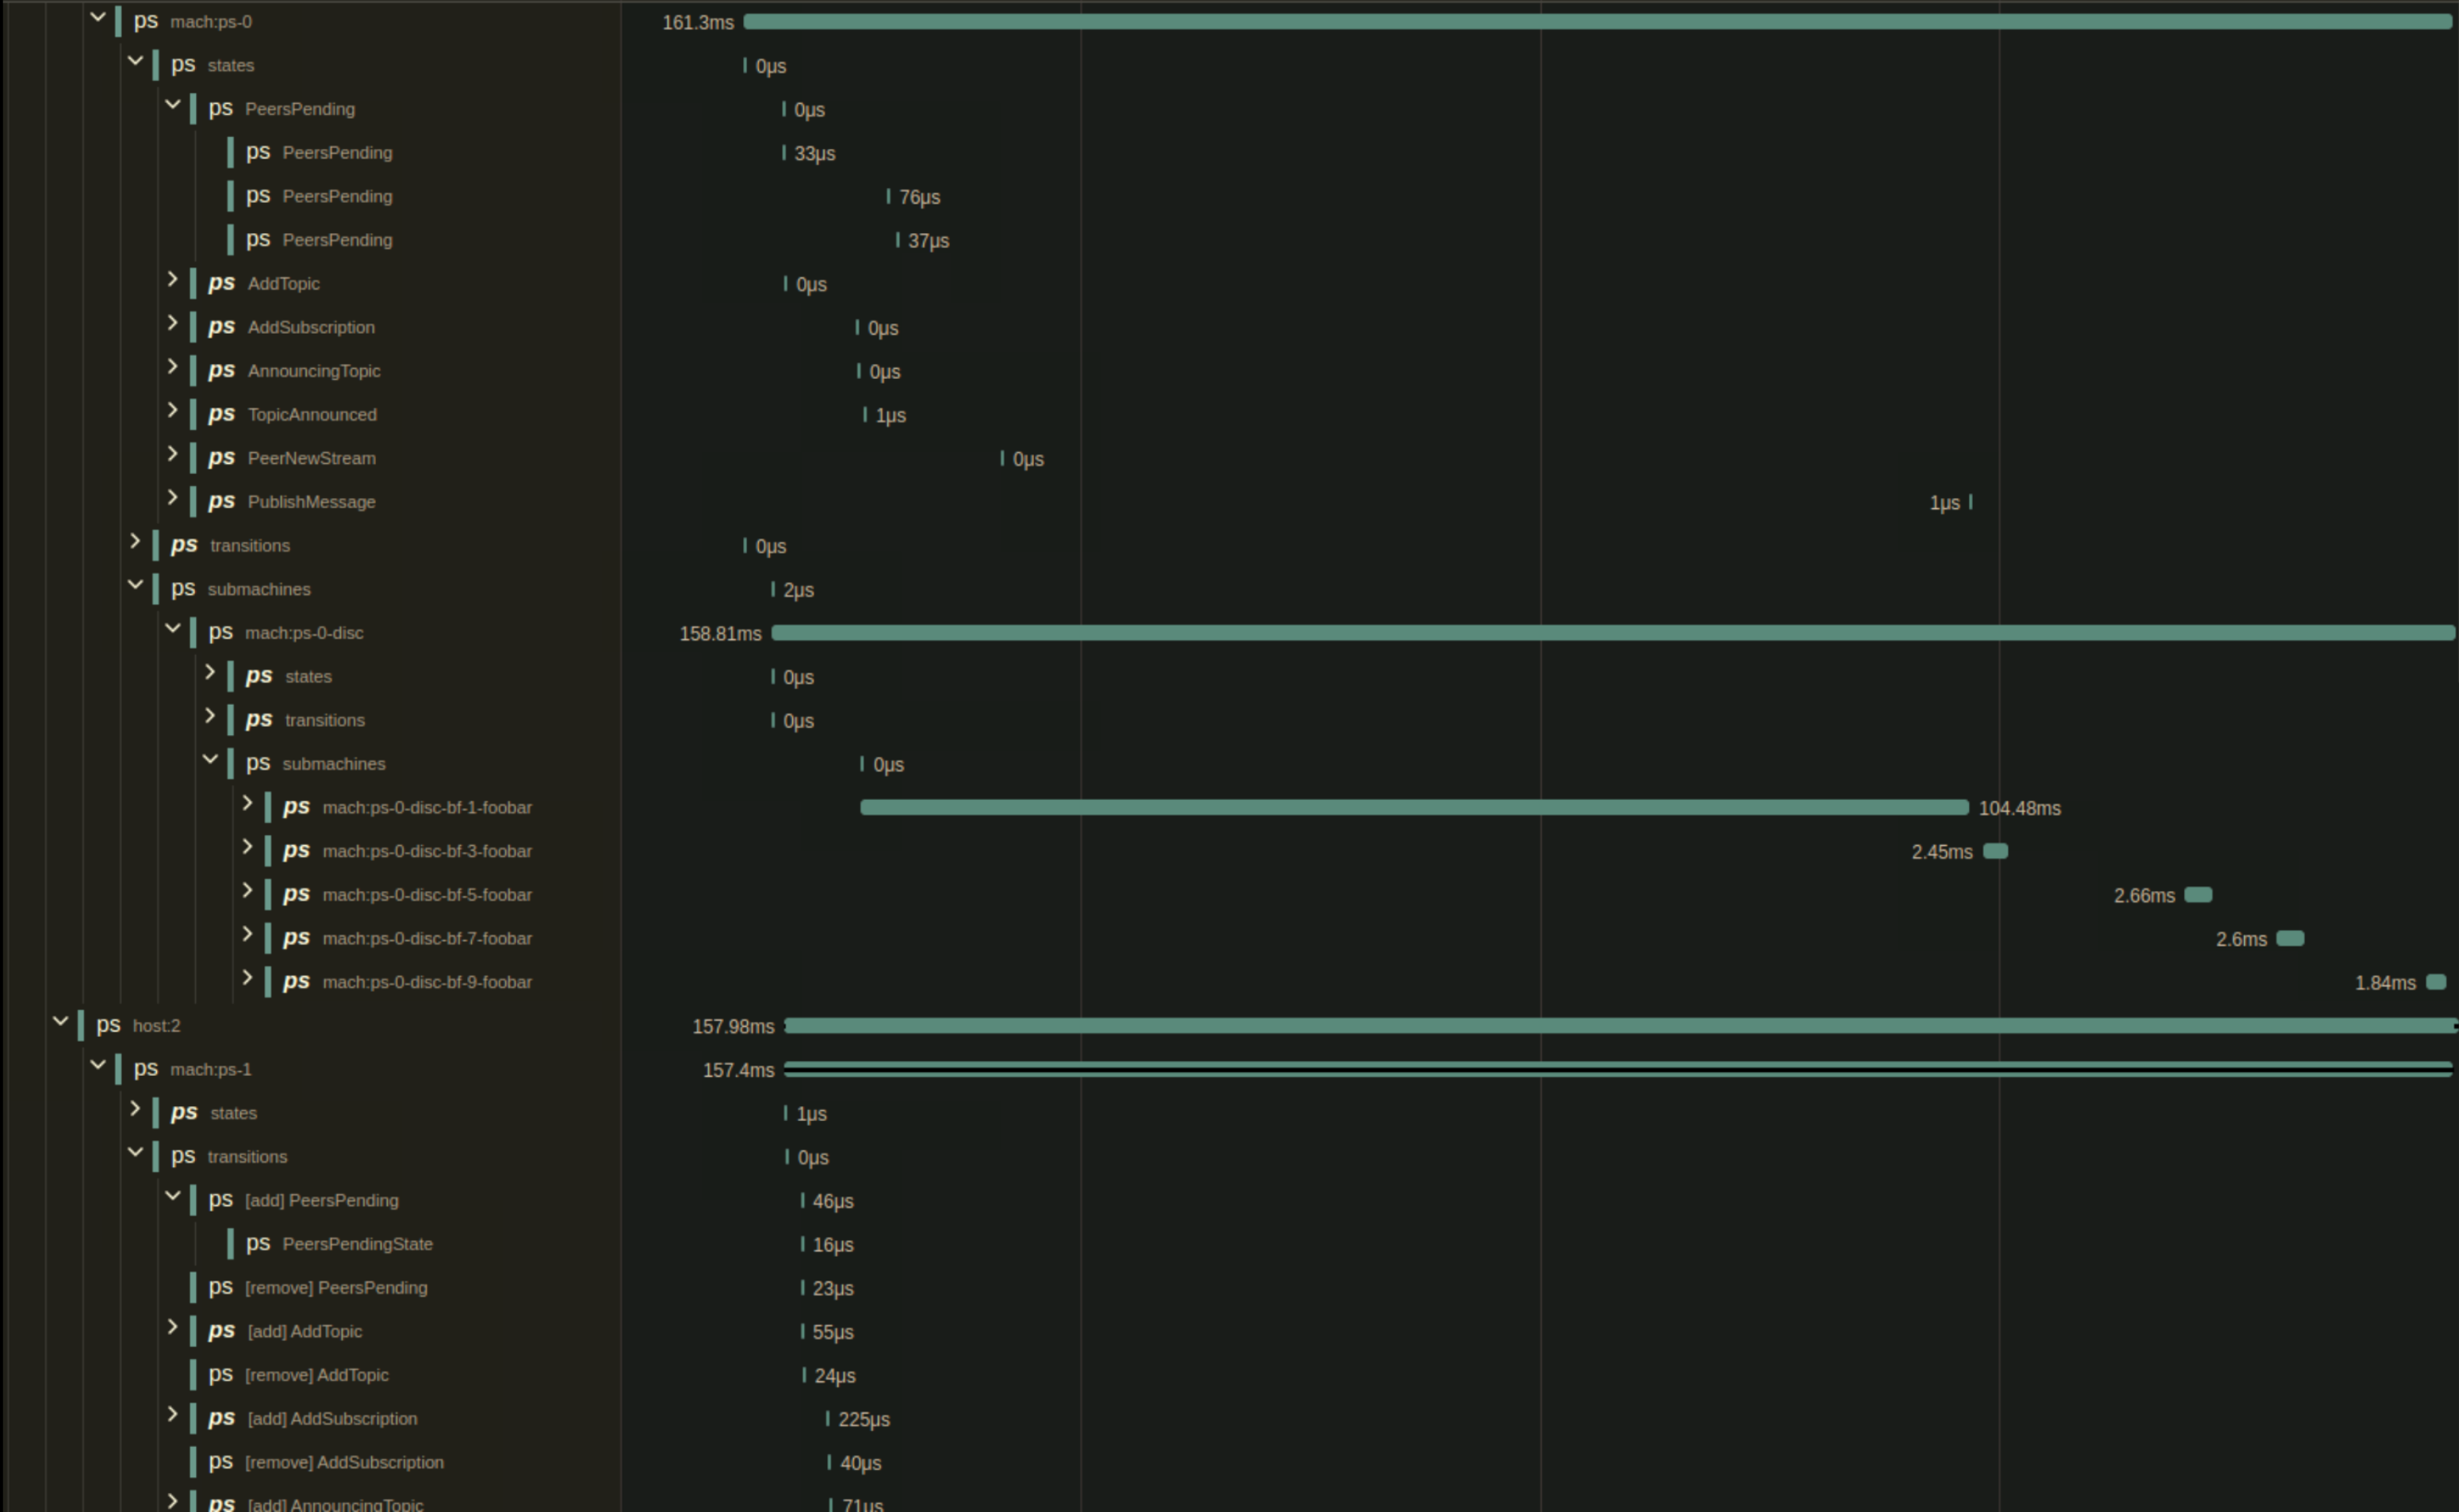
Open Telemetry traces integration exposes machine's states and transitions as Otel traces, compatible with Jaeger. Tracers are inherited from parent machines and form a tree.
- mach:ID
  - states
    - Foo
      - Foo (trace)
      - Foo (trace)
      - ...
    - ...
  - transitions
    - [add] Foo
      - FooEnter (trace)
      - FooState (trace)
      - ...
    - ...
  - submachines
    - mach:ID2
      - ...
    - ...
You can import an existing asset into your Jaeger instance for an interactive demo.
import (
    am "github.com/pancsta/asyncmachine-go/pkg/machine"
    amtele "github.com/pancsta/asyncmachine-go/pkg/telemetry"
    "go.opentelemetry.io/otel/trace"
)

// ...

var mach *am.Machine
var tracer trace.Tracer

machTracer := amtele.NewOtelMachTracer(tracer, &amtele.OtelMachTracerOpts{
    SkipTransitions: false,
})
mach.BindTracer(machTracer)Open Telemetry logger integration exposes machine's logs (any level) as structured Otlp format. It can be very handy for stdout logging.
import (
    "go.opentelemetry.io/otel/sdk/log"
    am "github.com/pancsta/asyncmachine-go/pkg/machine"
    amtele "github.com/pancsta/asyncmachine-go/pkg/telemetry"
)

// ...

var mach *am.Machine
var logExporter log.Exporter

// activate logs
mach.SetLogLevel(am.LogLevelOps)

// create a log provider
logProvider := amtele.NewOtelLoggerProvider(logExporter)
// bind provider to a machine
amtele.BindOtelLogger(mach, logProvider, "myserviceid")pkg/telemetry/prometheus binds to machine's transactions, collects values within
a defined interval, and exposes averaged metrics. Use it with the provided Grafana dashboard.
Tracers are inherited from parent machines.
import (
    "time"
    am "github.com/pancsta/asyncmachine-go/pkg/machine"
    amprom "github.com/pancsta/asyncmachine-go/pkg/telemetry/prometheus"
    "github.com/prometheus/client_golang/prometheus/push"

// ...

var mach *am.Machine
var promRegistry *prometheus.Registry
var promPusher *push.Pusher

// bind transition to metrics
metrics := amprom.TransitionsToPrometheus(mach, 5 * time.Minute)

// bind metrics either a registry or a pusher
amprom.BindToRegistry(promRegistry)
amprom.BindToPusher(promPusher)
Loki is the easiest way to persist distributed logs from asyncmachine. You'll need a promtail client.
import (
    "github.com/ic2hrmk/promtail"
    am "github.com/pancsta/asyncmachine-go/pkg/machine"
    amtele "github.com/pancsta/asyncmachine-go/pkg/telemetry"
)

// ...

var mach *am.Machine
var service string

// init promtail and bind AM logger
identifiers := map[string]string{
    "service_name": service,
}
promtailClient, err := promtail.NewJSONv1Client("localhost:3100", identifiers)
if err != nil {
    panic(err)
}
defer promtailClient.Close()
amtele.BindLokiLogger(mach, promtailClient)
Grafana dashboards need to be generated per "source" (e.g. process), by passing all monitored machine IDs and the source
name (service_name for Loki, job for Prometheus). See am-gen grafana. It will
optionally auto-sync the dashboard using K-Phoen/grabana (requires
GRAFANA_TOKEN).
am-gen grafana \
  --name "My Dashboard" \
  --ids MyMach1,MyMach2 \
  --source service_name_or_job \
  --grafana-url http://localhost:3000
Panels:
- Number of transitions
- Transition Mutations
- Queue size
- States added
- States removed
- States touched
- Transition Details
- Transition ticks
- Number of steps
- Number of handlers
- States & Relations
- Number of states
- Number of relations
- Referenced states
- Active states
- Inactive states
- Average Transition Time
- Errors
- Log view
Most of the exporters are automatically inherited from parent machines, so the results come in automatically. To define
a sub-parent relationship, use am.Opts.Parent
while initializing a machine. Alternatively, tracers can be copied using OptsWithParentTracers, or manually via
Machine.Tracers.
Testing, not semantically versioned.
Go back to the monorepo root to continue reading.

