Releases: nteract/semiotic
Canvas Rendering Improvements, Custom Networks
Features
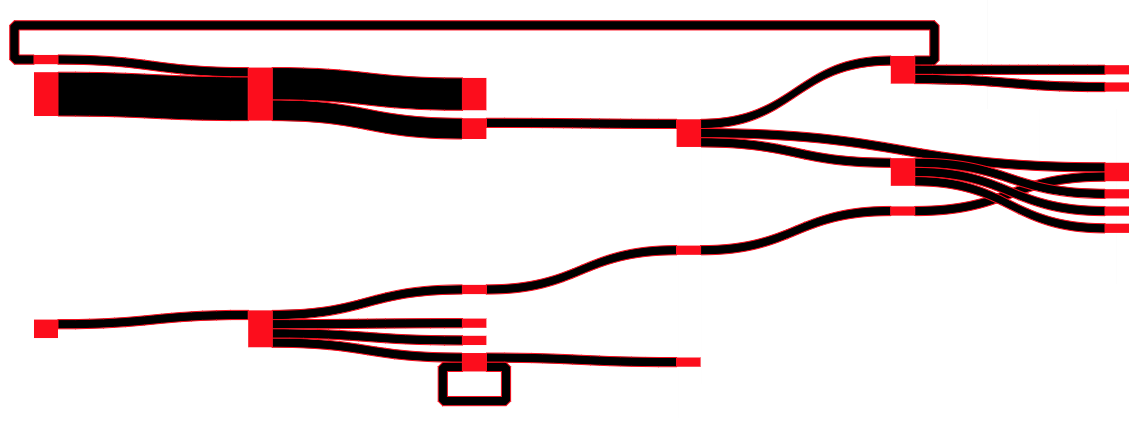
- You can pass custom
d3-forceSimulationsimulations to NetworkFrame, as asimulationparameter in thenetworkType. It's demonstrated here to create bubble charts and multi-foci charts. - All frames have a
baseMarkPropsthat can take an object with props to apply to all marks generated by the frame. This is primarily to leverage the new feature insemiotic-markthat lets you definedtransitionDuration. For now it only takes an object, so you can across the board set transitions to be something other than the 1000ms default that Semiotic has been using up to this point. You can try it out in your frame by adding something like:
baseMarkProps={{ transitionDuration: 2000 }}
To set all transitions to 2 seconds or something more nuanced like:
baseMarkProps={{ transitionDuration: { default: 500, fill: 2500 }}}
To make fill transitions take 2.5 seconds and all other transitions take 0.5 seconds.
canvasPieces&canvasConnectorsare now honored in<ORFrame>and will render those elements to canvas.canvasSummariesis still not available.canvasPostProcessis available on all frames. It is fired after canvas rendering and is passed(canvas, context, size)so you can graphically modify your chart. For instance if you want it to have a glowy look like this:

You can add the following code to the Frame:
   canvasPostProcess={(canvas, context, size) => {
  const dataURL = canvas.toDataURL("image/png")
  const baseImage = document.createElement("img")

  baseImage.src = dataURL
  baseImage.onload = () => {
    context.clearRect(0, 0, size[0] + 120, size[1] + 120)
    context.filter = "blur(10px)"
    context.drawImage(baseImage, 0, 0)
    context.filter = "blur(5px)"
    context.drawImage(baseImage, 0, 0)
    context.filter = "none"
    context.drawImage(baseImage, 0, 0)
  }}
It also will do a fun Chuck Close style pixelation if you pass canvasPostProcess={"chuckClose"}
Changes
- This uses
semiotic-mark@0.1.0which no longer uses flubber. Instead, complex shapes that won't transition well don't use transitions. Flubber was too big and still caused distracting changes in shapes when doing the interpolation--it's great for abstract shapes but not so great for the lines and areas in a traditional chart. - Default for
<XYFrame>'slineIDAccessoris nowd => d.semioticLineIDinstead ofd => d.idbecause the latter would conflict with the occasional dataset.
summaryType Bug Fixes
Fixes a major bug where horizontal summaryType was reversed and a little bug where Joy Plots weren't quite aligned.
Improved customMark for ORFrame "timeline" type
"timeline" type in ORFrame sends better settings to the customMark generator
Sankeys with Cycles
Features
- Sankeys in
NetworkFramenow accept networks with cycles and render them using Tom Shanley'sd3-sankey-circularlayout.

- Add a
relativetag to bucketized summaryTypes inORFrameto allow the visualization to display the relative size of the data (with the max being the max value for that category) as opposed to the default behavior which sizes graphical elements by the max value across all categories.
Fixes
- Margin has been fixed so that passing a numerical value is properly treated as margin for all sides.
Multisubject Annotations & Custom Point Marks
Features:
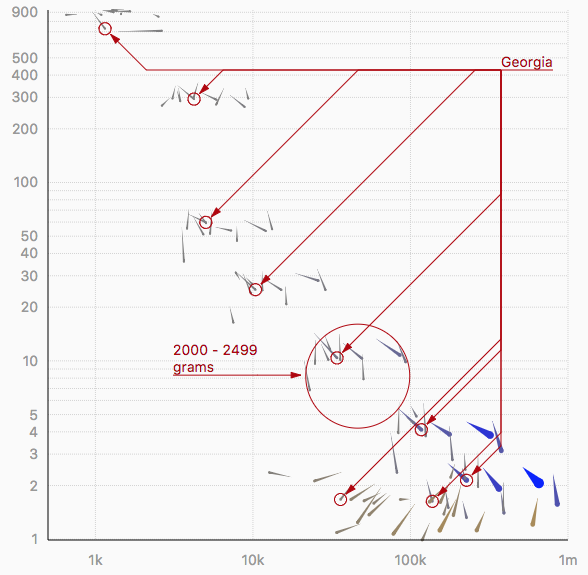
- All axes will automatically draw a
<line>element with classaxis-baselinealong the baseline of the axis. You can restyle or hide it with CSS. react-annotationannotations in XYFrame and ORFrame will honor acoordinatesarray and draw multi-subject annotations when you send datapoints in that array.customPointMarkin XYFrame can now return any JSX SVG instead of just asemiotic-mark<Mark>element. It also passes{ d, i, xScale, yScale }so you can draw marks whose shape depends on data values in chartspace.
Fixes:
motifsmode in NetworkFrame is working again. Singletons are now sorted into a single component.
You can see most of this in action in the Comet Plots example.
Timelines and TickLines
in ORFrame
-
pixelColumnWidthin ORFrame now allows you to specify the size of a column as a number and will result in a frame with a size based on the number of columns times the specified size -
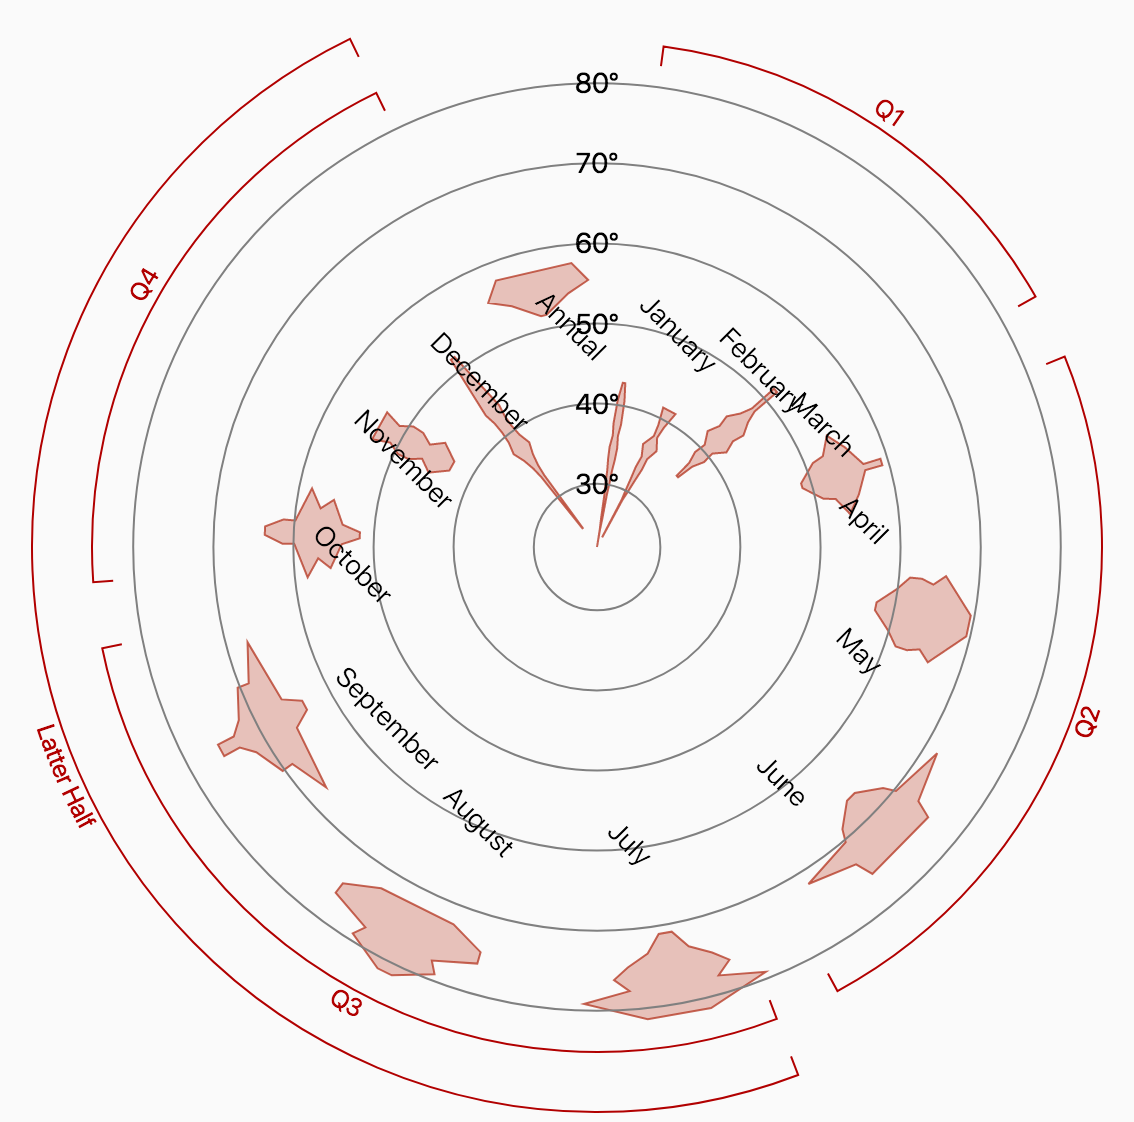
timelineis a new type that requires anrAccessorthat returns a two-piece array that designates start and end of timeline/Gantt chart-style bands of data.
in Axis
ticklineGeneratorallows you to specify a function which will be passed ({ xy, orient }) which you can return SVG JSX to draw your own custom tickstickSizeallows you to specify the pixel length/height of the tick generated by the axis. Use negative values to draw away from the chart. Use multiple axes on the same orient if you want to draw and overlap different axes or useticklineGeneratorto draw a more custom tick
Fixes, static version, more examples
FIXES
- Whole pie piece pie charts will not honor
oPaddingand slices will not end up with negative size if reduced byoPadding. - Annotation handling updates other properties even if it's not required for the annotations to change, also support a
dataVersionflag inbumptype annotation layouts so you can tell it to re-fire the layout - Curly arc brackets were incorrectly calculating the
largeArcFlagresulting in cool but terrible arcs
FEATURES
unpkgsupport from @tmcw!- Honor new extents in brushes to allow programmatic brush extents (feature shown in the Swarm Brush, Line Brush and Minimap examples)
NEW EXAMPLES
Show how to use the MinimapXYFrame as an isolated example

https://emeeks.github.io/semiotic/#/semiotic/minimap
Fun with backgroundGraphics

https://emeeks.github.io/semiotic/#/datasketches
Little Fixes
This update resolves a few problems most people wouldn't have run into unless they were using the advanced annotation features, like when your annotation attributes change but your annotation layout doesn't say they need to be repositioned.
It also adds a more accessible new example for a custom type in ORFrame:
https://emeeks.github.io/semiotic/#/semiotic/custommark


