-
Notifications
You must be signed in to change notification settings - Fork 2.8k
New issue
Have a question about this project? Sign up for a free GitHub account to open an issue and contact its maintainers and the community.
By clicking “Sign up for GitHub”, you agree to our terms of service and privacy statement. We’ll occasionally send you account related emails.
Already on GitHub? Sign in to your account
Memory usage abnormaly growing overtime #2794
Comments
|
@TAnas0 are you able to reproduce this by doing the exact same actions (like having the console opened etc.) but on your local machine? |
|
@ecthiender Thanks for your interest. I am working on a local setup of the architecture, and it has a lot of (suspect) components that might be triggering this. But as I said, I have no reliable way of reproducing the behavior, so I will have to wait for it to (un?)hopefully reappear. I'll be back at you after some testing |
|
I replicated a Hasura instance using Docker Compose and configured it to use the same managed PostgreSQL instance that is used in production. I left it on for several hours, made sure to have several consoles open, and used the API for read/writes originating from the same components I am using in production. But I couldn't reproduce the behavior and It is also worth noting the the read/writes were not as heavy as they are in production, since we are using scalable microservices for inserting into the database (Serverless and Google Cloud Run). So I believe my local setup is considerably different than production, hence the results can't be really conclusive. The only interaction with the Hasura API that I couldn't try on my local setup, is a bunch of frontend GraphQL subscriptions.
Cheers |
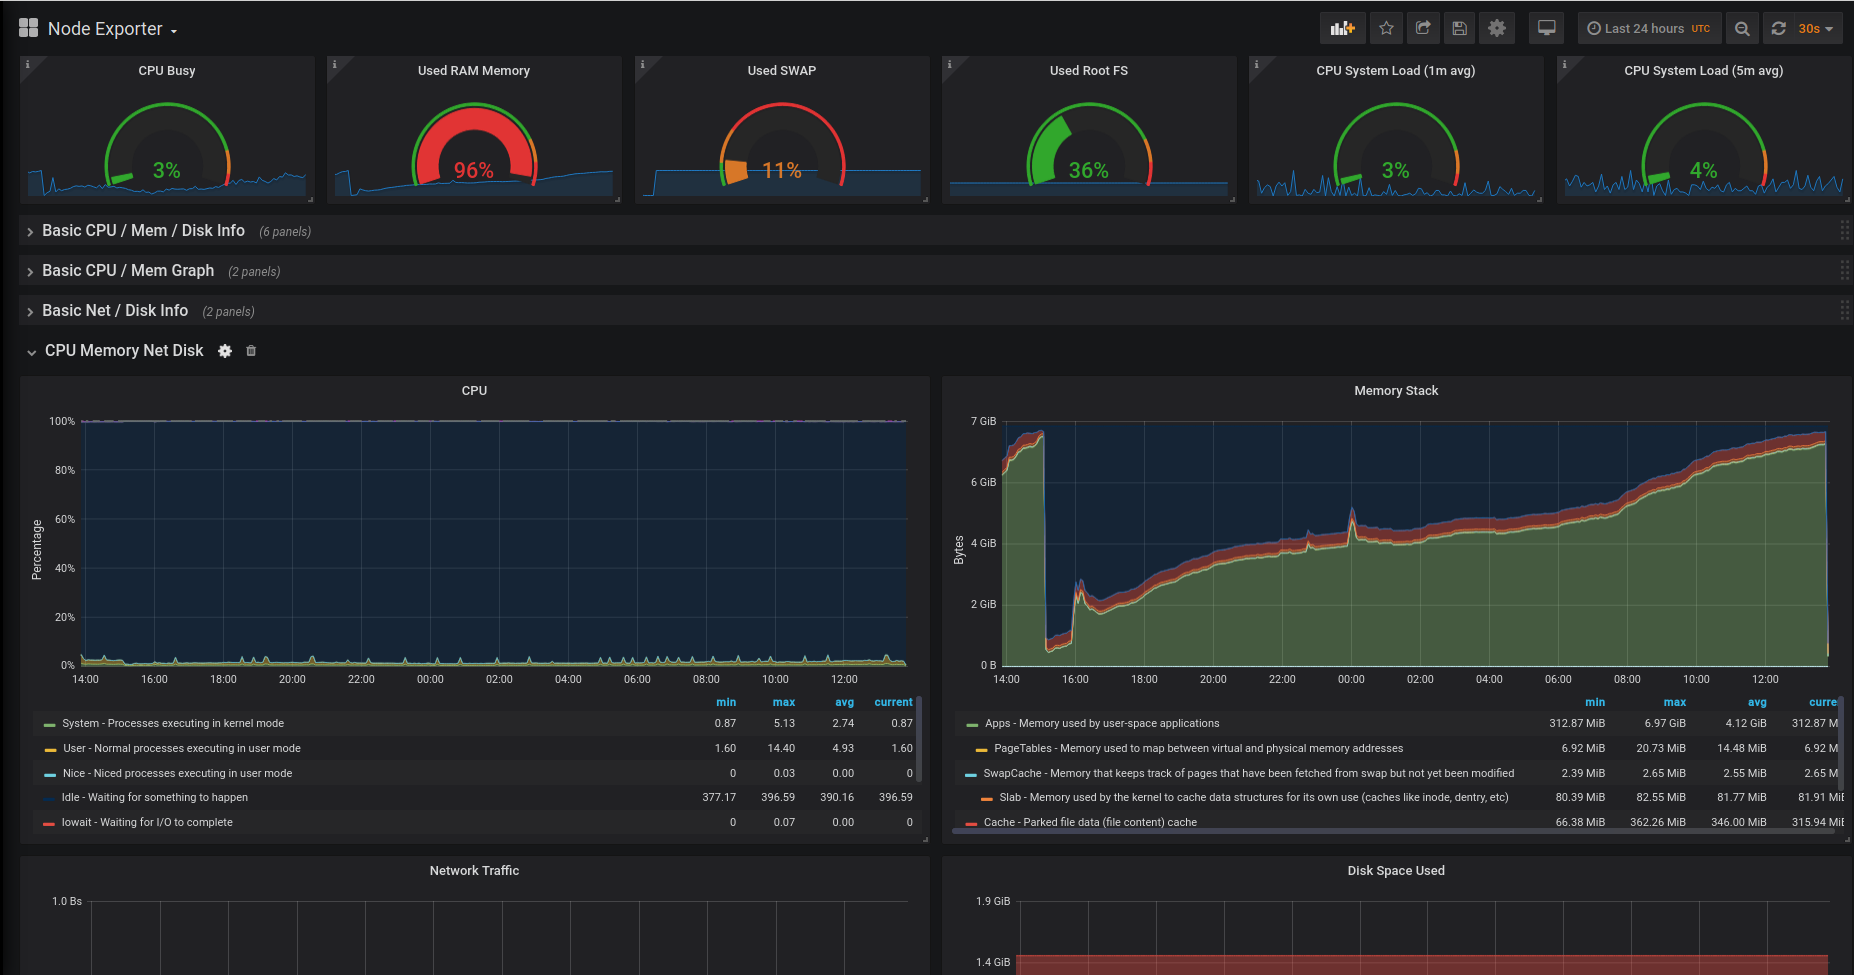
Update on the situation:My droplet's RAM spiked again, after droping. This is a graph from the last 7 days: I am also exposing a dashboard, thanks to Netdata, from the droplet to get further insight: droplet's dashboard. Executing I can see from the latest release's notes that Websockets gracefull shutdown is not yet supported, but is on the map and there is subject of talk in the following issue and pull request: #2698 & #2717 Cheers |
|
(Linking to #3388 which I've been using as the canonical memory leak issue, for referencing in PRs, etc.) |
|
Maybe related to #3879 |
|
@TAnas0 @fmilkovic We've released v1.1.1 which should fix this, can you please try it out and let us know? |
|
Running new version for about an hour, looks like its fixed. Thank you. |
|
@0x777 We have moved on from this setup for quite some time now I must note that for me it took more than few hours before the droplet's CPU starts acting out. Also the issue #3879 linked by @jberryman looks like the perfect suspect, because I remember using subscriptions heavily. Will close for now, thanks all, and @fmilkovic feel free to reopen if you face it again |


Hello,
I am using Hasura as a backend, deployed on a droplet in DigitalOcean, initially using the DO marketplace. The database is managed and everything is working fine.
The problem I am facing is that the memory usage displays a weird behavior, where it slowly accumulates and then seems to get "flushed". I was able to verify this by watching the consumption of the
graphql-engineprocess. Also, near the peaks, the API becomes unresponsive/slow for quite some time.I looked into this similar issue #2565 (dealing with CPU consumption), and tried to disable garbage collection in my docker-compose file, but the behavior still reappeared.
I must also note that this happens "randomly", or rather I have no way of reliably reproducing it, since I don't know what is causing it. It may be related to Hasura, Docker or Digitalocean.
I am looking for help to pinpoint its cause and maybe solve it. Any help would be appreciated.
Also, can this be related to the console being opened? I heard the most memory leakage problems are due to hungry frontends ran on browsers.
The text was updated successfully, but these errors were encountered: